Merry Christmas!
The Wx Access Map for Jackson Hole (Wx is shorthand for Weather, by the way) is designed so that you can access both current weather observations and forecasted weather for specific locations in the Grand Teton & Yellowstone Park region.
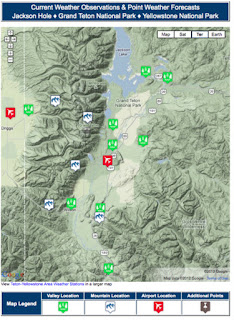
The coverage area on this particular map, if you scroll out, extends from Bondurant to the south, all the way to Mammoth in the northern part of Yellowstone Park. East to Togwotee Pass and West to Idaho Falls.
Each Icon on the map is located where there is a weather station, at a variety of valley, airport, and mountain locations.
See the bottom of the Wx Access Map page for an explanation of the different formats that are available for you to view, for both weather observations and weather forecasts for these locations.
Where there is a webcam nearby, or one that has a view in the direction of the station, a thumbnail link to that is included in the pop-up window.
At the bottom of the page are the local Satellite & Radar maps, etc.
What is a “Point Forecast”
Before you completely abandon the forecast I produce each weekday for Jackson Hole & the Teton Mountains, you should understand how these point-forecasts are derived.
“Point-Forecasts” are available everywhere on the internet now, they are the “go-to” tool that most websites are using to generate a “local” forecast. They are a bi-product of the National Digital Forecast Database (NDFD) from the National Weather Service and are almost completely computer generated from almost 3 million data points across the Continental US. There is some human input involved, as NWS forecasters have the ability to tweak the data they get from the NDFD, adjusting temperature lines, etc. But after that, it is the computer that interpolates all the weather variables “between the lines”.

The “point” part of the forecast isn’t exactly a pin-point location, but rather a grid box that covers an area of a couple of square miles, or roughly the size of Jenny Lake. But in the mountains, that includes all elevations within that grid box. Again, the data you get is interpolated for that approximate latitude, longitude, and elevation.
Point-Forecasts have a very high “coolness factor” to them because of the endless graphical display possibilities, and the ability to give you forecast data by the hour! But we all know, the weather changes, a lot, and the actual weather you get may vary considerably from what the forecast says is going to happen.
I have meticulously selected the closest representative grid box for each of the locations on the map, to give you the best representation of the weather forecast information as possible, for both the NWS versions and the WeatherSpark version.
Check out what the guys at WeatherSpark have done with their graphics, of basically the same data! There’s hours of fun to be had playing with their graphs! When you click on a link to a WeatherSpark Point Forecast, their Google map to the left, locates the station and also has local radar overlaid on the map. Close that map to see more of the graph. Use your mouse wheel to expand or contract the graph. Very COOL!
Caveats
Keep in mind as you use these forecasts, as with any forecast, they are “guidance” not “gospel”. And I have found that the point forecast data does well with temperatures, not as good with wind, and even less good with precipitation probability and amount.
Where this map will be most useful for me is for areas just outside of the Teton area, up into Yellowstone or on Togwotee Pass, or down the Hoback. Places that are outside the coverage area of the MountainWeather Forecast for Jackson Hole & the Tetons.
I still do my Jackson Hole Forecast from scratch every weekday, and there is way more human input going into that forecast than what goes into the computer generated point forecasts.
Just like a new toy at Christmas, play with this map and see how you like it. Please send me feedback on what you like or don’t like about them and I will try to make changes as this project moves ahead.
Additional points may be added to this map in the future, to cover popular locations that do not have a weather station associated with them, to at least provide the point forecast for those locations. Although, I will be hesitant to crowd the map with too many icons. You are welcome to send me a request for your favorite spot on the map. If I get enough requests for that spot, I’ll consider adding an icon.
More to Come
The Wx Access Mapis phase-one of a project I have been working on since early this past summer. The Jackson Hole-Teton-Yellowstone Map is the first to be completed. Others will follow this winter, for each of the Mountain States. A Wyoming Weather Page will be finished very soon, the other Rocky Mountain States will get their own weather pages next, then the final phase will include pages for the Pacific Northwest (WA/OR/CA).
The individual Mountain States pages will be more or less one-stop weather pages that will include some quick-look, easy to interpret, weather information. As well as, a Wx Access Map for each state.
Happy Holidays from MountainWeather!
Posted by meteorologist Jim Woodmencey
WOW! Merry Christmas Jim. Looking over the new page is really fun and informative. I think we will all enjoy it.
Rose