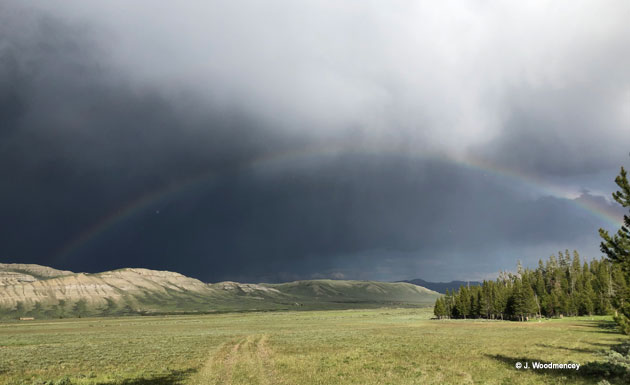
We’ve heard a lot in recent months about how bad drought conditions are across much of the western United States. As of June 30th, 2022 most of Teton County, Wyoming is still listed in the severe drought category. Considering how green everything looks outside on the First of July, and how much rain we had in April. May and June, that might be hard to believe.
Digging in to how drought conditions are determined, gives some insight into how the U.S. Drought Monitor Map is made each week.
Above Normal Precip
When we talk about drought conditions the first thing that comes to mind is how much moisture, or lack thereof, we have had. Data from the Town of Jackson Climate Station shows that over the 8 month period, between October 1st, 2021 and May 31st, 2022, town had received 11.27 inches of precipitation. By the way, October 1st is when our water year begins.
The long-term average precipitation in Jackson for that same 8-month period is 10.80 inches. In other words, Jackson’s precipitation is above normal right now, by almost half an inch.
Unfortunately, there was missing data at the Jackson Climate Station in mid-June, so June’s precipitation total is not available. But we all know that there was plenty of rain and I suspect that the total was at least near the monthly average of 1.63 inches.
Granted, we had a relatively dry winter, with below average precipitation from January through March. Although we also had a very wet fall, with above average precipitation in October, November and December. This spring it got wet again, with above average precipitation in both April and May.
Despite above average precipitation for five of the last eight months, there are other factors to consider when determining drought conditions.
Drought Indicators
Besides precipitation, things like soil moisture, streamflow, snowpack and the Palmer Drought Index, all factor into categorizing the severity of drought in a particular region. The Palmer Drought Index compares current precipitation amounts to normal precipitation numbers and also considers things like evapotranspiration, infiltration of water into the soil, and runoff.
Locally, the Teton Conservation District monitors the snow water equivalent in the headwaters of the Snake River, which actually peaked later than average this year, due to a snowy April. At the beginning of June, there was still 4 to 5 feet of snow depth yet to melt at the 9,500-foot elevation in the Tetons.
The Conservation District also keeps tabs on the groundwater depth in the valley, which has been running below normal since January of 2022. At the end of May 2022 groundwater depths remained deeper than the average depth for this time of year.
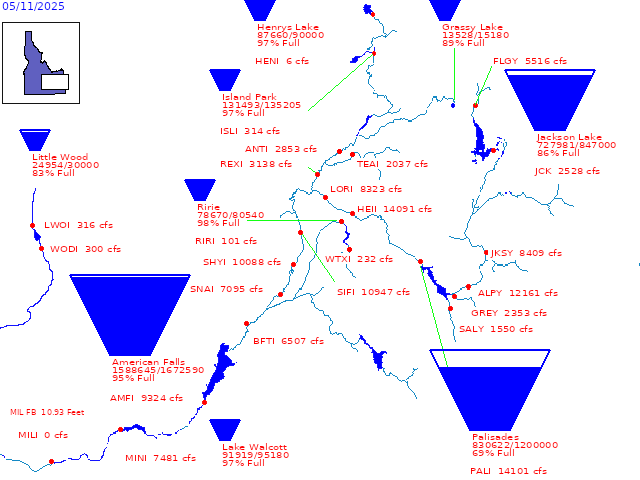
The last thing that is considered in the calculation of drought conditions is reservoir levels. Locally, both Jackson Lake and Palisades Lake were quite low through most of June. On June 30th, Jackson Lake was at 48 percent full, Palisades was up to 76 percent. Palisades was below 40 percent just two weeks prior.
Since water managers look at stored water when considering how much water will be available for irrigation or agricultural uses, reservoir levels weigh in as a big part of the drought equation.
In the case of the Upper Snake River drainage, the low water levels in the reservoirs began last summer, when both Jackson and Palisades were drawn down to accommodate downstream dam reconstruction. Thus, making our drought conditions some what fabricated or man-made, if you will, by the Bureau of Reclamation.
Drought Monitor Map
The Drought Monitor map is compiled nationally by a number of different entities, including: The National Drought Mitigation Center (NDMC) at the University of Nebraska-Lincoln, the National Oceanic and Atmospheric Administration (NOAA), and the U.S. Department of Agriculture (USDA).
The map is updated every Thursday, identifying areas of drought and rating the intensity of drought on a scale of D0 to D4. On the lowest end of the scale, D0 indicates abnormally dry conditions. D1 is Moderate drought, D2 is Severe, D3 is Extreme, and D4 is Exceptional drought. Earlier in June, Teton County was in the D2-D3 category. Wyoming as a state rarely ever experiences D4 conditions, or exceptional drought.
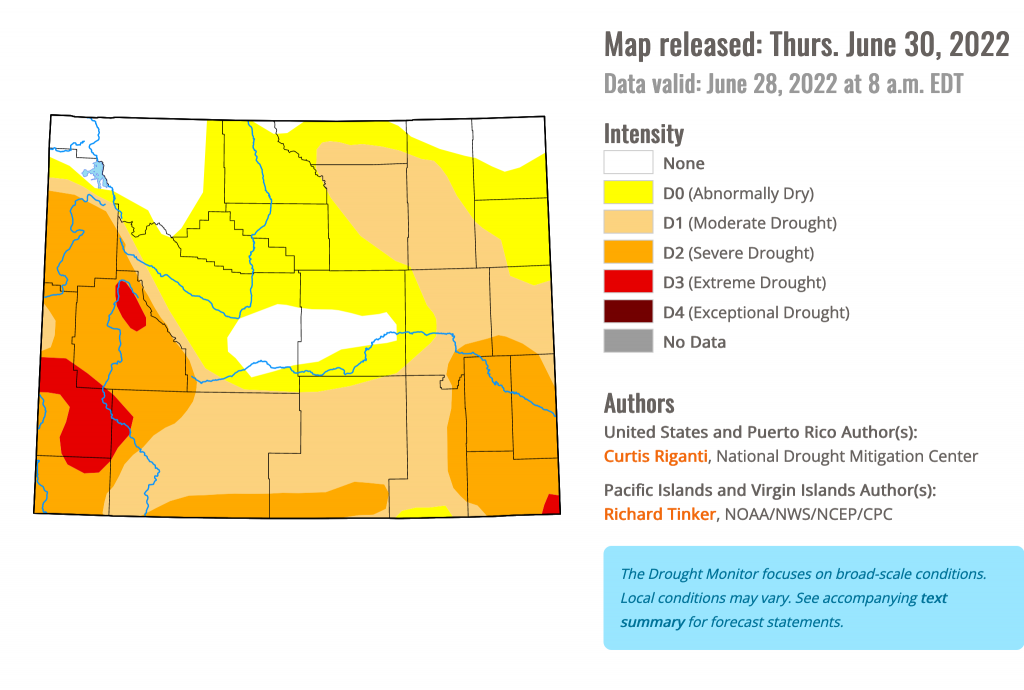
Each state has their own criteria for what those intensity numbers mean, based on the impact the drought conditions will have on that region of the country. For Teton County, low snowpack in the mountains affects runoff and groundwater, with impacts to streamflow, stream water temperatures critical to fisheries, and vegetation for grazing.
By definition, when you are in the D2 category, pasture conditions are poor, trees and vegetation are stressed, and well levels decline. In D3 category, snowpack is low, and surface water is inadequate for ranching or farming.
I suspect if the Bureau of Reclamation continues to draw down water from Jackson Lake and Palisades this summer, that will put us back into the D3 or severe drought category, no matter how much rain we get n July and August.
Jim is the chief meteorologist at mountainweather.com and has been forecasting the weather in Jackson Hole and the Teton Range for over 30 years.
Note: This post was updated from an article that originally appeared in the Jackson Hole News and Guide on June 15th.