News headlines around the globe last week proclaimed that July 4th, 2023, was the hottest day ever recorded on Earth. Some of those headlines read: “Planet’s temp hits new high”, “Earth’s hottest day in recorded history”, “Alert: The hottest week on Earth”.
Temperatures apparently broke the record four days in a row, from July 3rd to July 6th. Oh my, that’s alarming, especially since it is only early July and our warmest days, in the Northern Hemisphere at least, are yet to come this month and into August.
If you were to look under the hood though and read past the headlines, you would discover that these temperatures were “unofficial”. And the data set used only went back as far as 1979.
The data used to make those proclamations was generated from a computer model run at the University of Maine. The model, known as the Climate Forecast System Reanalysis (CFSR), incorporates temperature readings from land surface stations, weather balloons, satellite measurements and ocean buoys to arrive at an estimate for the planet’s mean temperature at hourly intervals throughout any given day.
Not so Fast
On July 6th, 2023, the National Oceanic and Atmospheric Administration issued a note of caution about the University of Maine’s findings, saying it could not confirm data that is in part a result of computer modeling.
“Although NOAA cannot validate the methodology or conclusion of the University of Maine analysis, we recognize that we are in a warm period due to climate change,” NOAA said.
NOAA also noted that the reanalysis data was “not suitable” as a substitute for actual temperatures and climate records.
Actual temperature records from NOAA’s Global and United States Historical Climatology Networks (GHCN & USHCN) date back to 1895. For the lower 48 U.S. states, where the majority of stations with the longest records are located, NOAA’s data shows that it was much warmer in the early 1900’s.
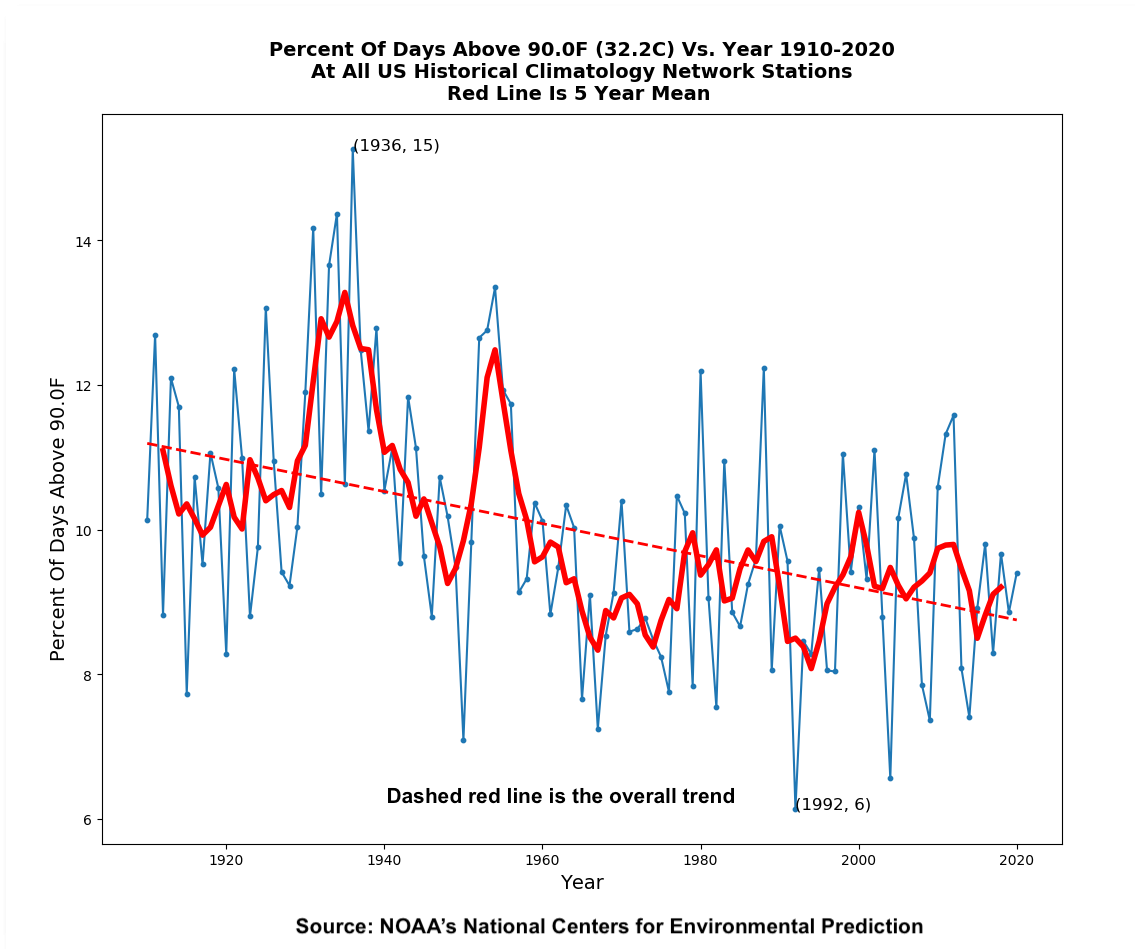
NOAA’s data shows that the percentage of days above 90 degrees F, annually, at all U.S. stations, has been declining (Graph 1). The peak of the heat occurred back in 1936, with 15 percent of the days that year at all US stations above 90F. This provides further evidence that HOTTEST DAY EVER on the planet occurred this July even less feasible.
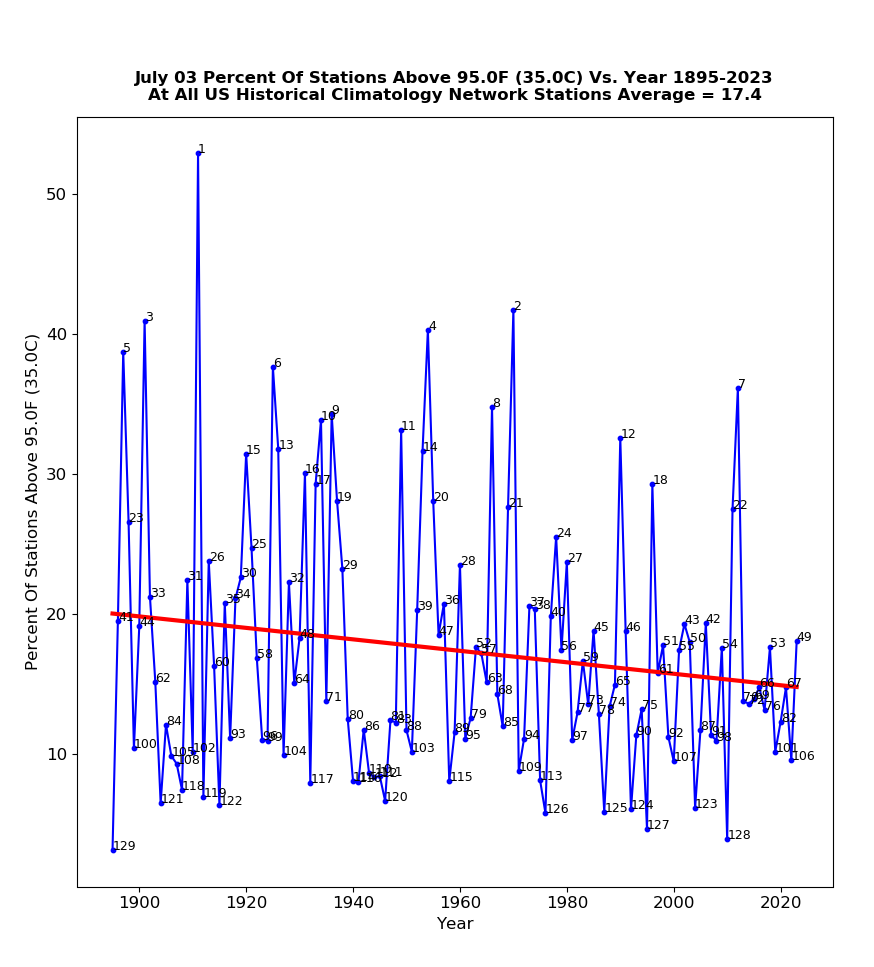
A different analysis of USCHN temperatures showing the Percent of Stations that got above 95F for the date July 3rd, which is the first day of the supposed new record high temps. This graph below (Graph 2) shows that July 3rd in 2023 only ranked as the 49th warmest July 3rd in the last 128 years in the United States. That makes it hard to believe that the rest of the world could somehow propel the planet to the number one spot this July.
Heat Waves & Record Highs
Granted, there have been some brutal heat waves these past couple of weeks around the country and in certain parts of the world, but it was not the hottest ever. At the same time, there have also been areas of the globe that were much cooler than average.
In the United States, records dating back to the late 1800’s and early 1900’s show the Heat Wave Index has been fairly steady, with the biggest spike and warmest period of time ever in the US occurring in the 1930’s, during the Dust Bowl. Many of the all-time highest temperature records from the 1930’s still stand today. (Including The Town of Jackson, WY, when it was 101 degrees F in July of 1934)

This graph shows the annual values of the U.S. Heat Wave Index from 1895 to 2021. These data cover the contiguous 48 states. An index value of 0.2 (for example) could mean that 20 percent of the country experienced one heat wave, 10 percent of the country experienced two heat waves, or some other combination of frequency and area resulted in this value. Data source: Kunkel, 2022, EPA https://www.epa.gov/climate-indicators/climate-change-indicators-heat-waves
Note: When viewing the EPA site, the graphs on the page this link opens to on Heat Waves shows bar graphs that only go back to the 1960’s. You have to click on the link for Figure 3, Heat Wave Index to see the graph shown here.
Latest Daily Records
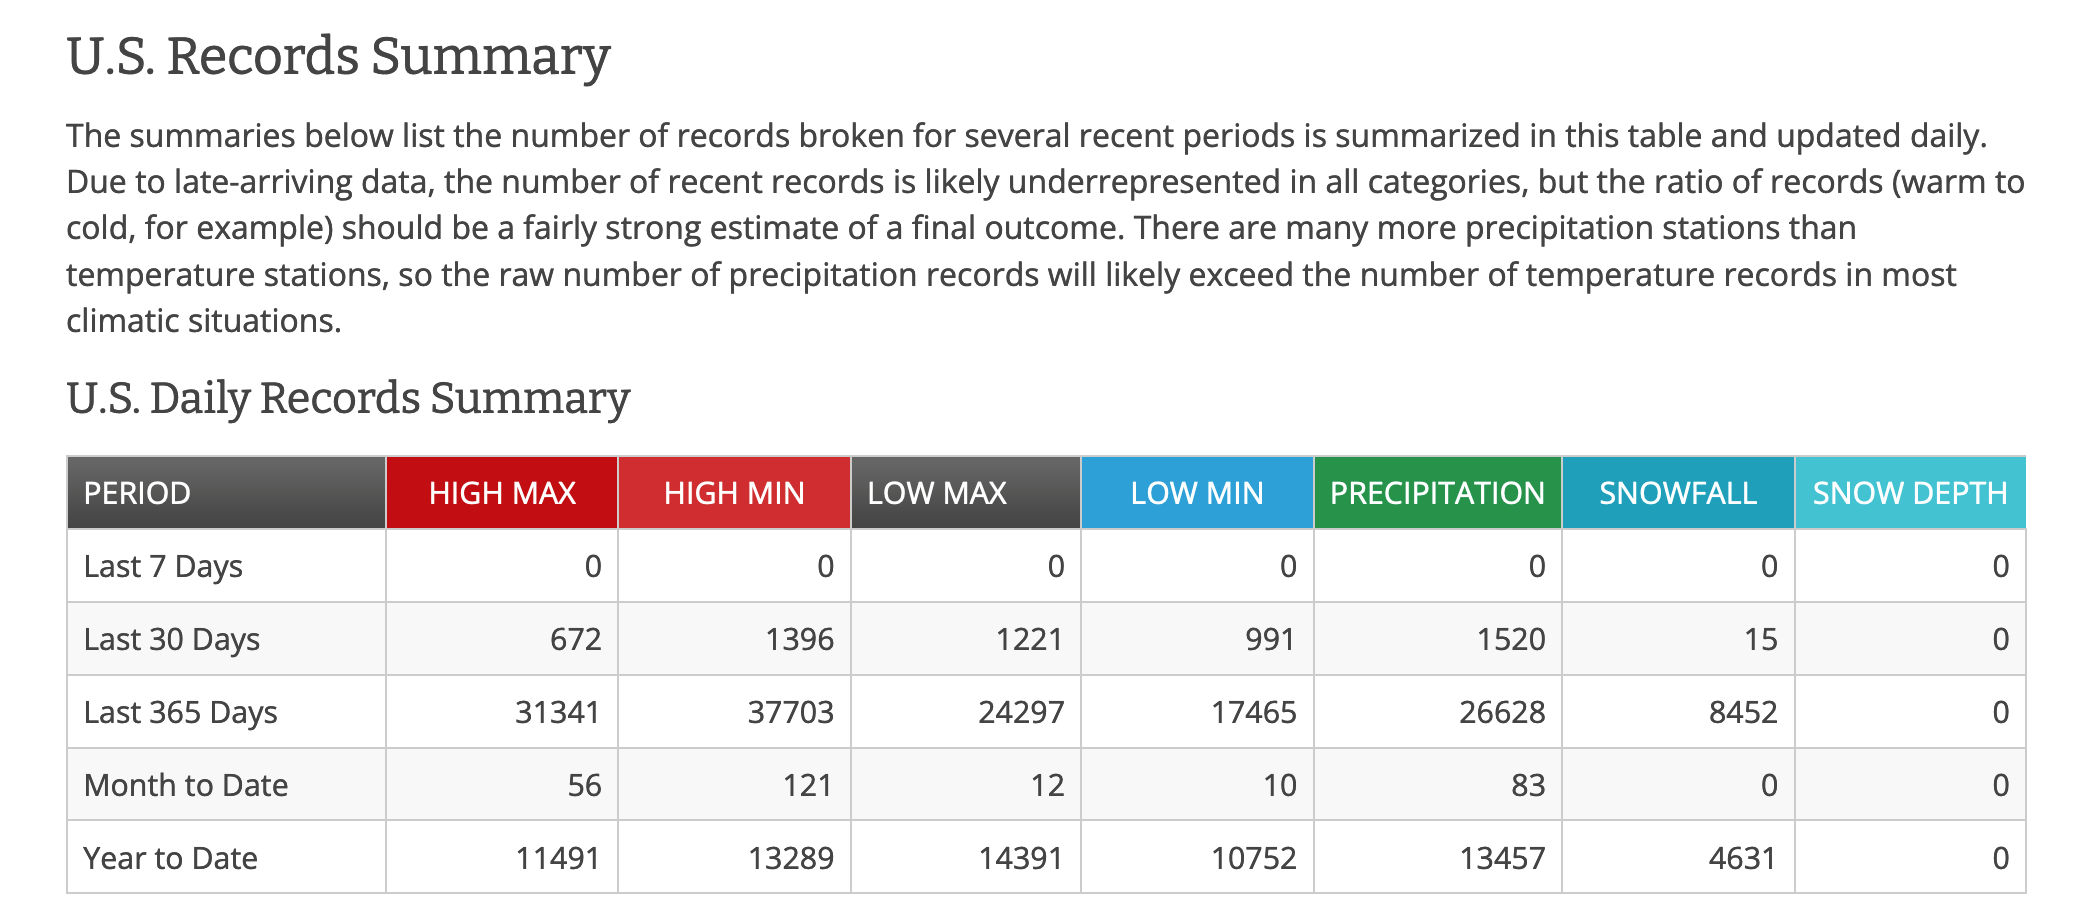
NOAA’s database of daily weather records across the United States also shows that in the last 30 days (from June 9 to July 9, 2023) there were 672 record high maximum temperatures set. At the same time, there were nearly twice as many low maximum temperature records established, 1,221 of them. There were also 991 record low minimum temperatures set in the last 30 days. (See the data below).
Alas, cold temperatures don’t make headlines these days. Unfortunately, the story that the Planet was “hotter than it has ever been” this July will become the catchphrase and taken as scientific gospel going forward. Even if the data used was unofficial, incomplete, and misleading.
Additional Info to Add…from others
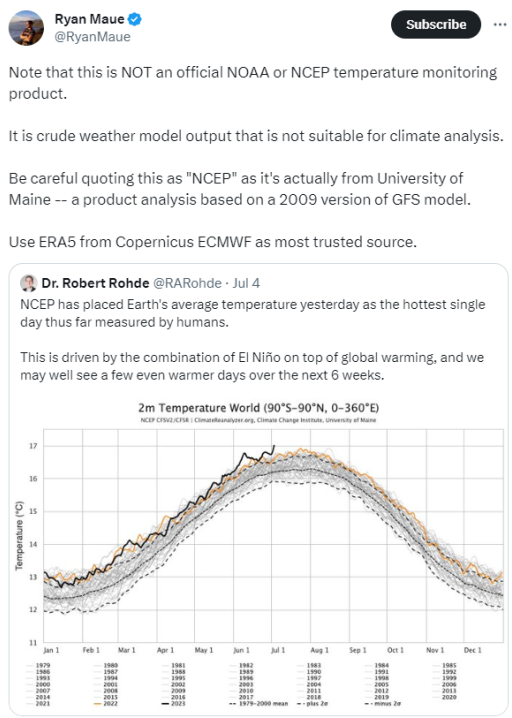
Some people, such as Ryan Maue, Ph.D., tried to put out the wrongheaded social media fire on Twitter. He notes that the climate model used isn’t even current, circa 2009/2011:
It seems the media, social and otherwise, saw what they expected to see and got fooled. They failed to check the source of the data before rushing to judgment.
The graphic below shows the big “heat source” that caused the panic – an apparent glitch (or short term outlier anomaly) in model output that made it look like the waters off Antarctica were boiling hot, and when “averaged” over the entire globe, made that false 17°C uptick.
It isn’t even an up to-date climate model, circa 2009/2011 and is not an official NOAA or NCEP climate modelling product.

Some Additional July 4th Graphs of Temps
Below are couple of other graphs worth considering. One shows the average maximum temperatures on the 4th of July each year at all US stations. The other shows the percentage of stations that that were over 100 degrees F on the 4th of July each year. Both have been slightly declining.
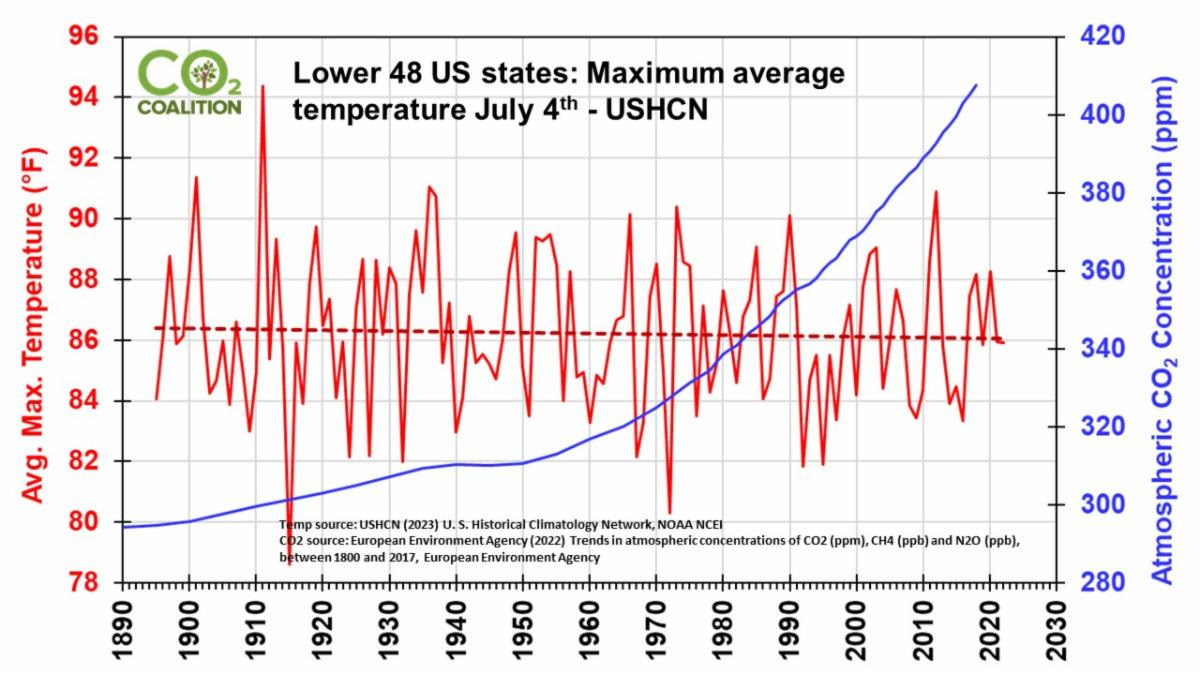
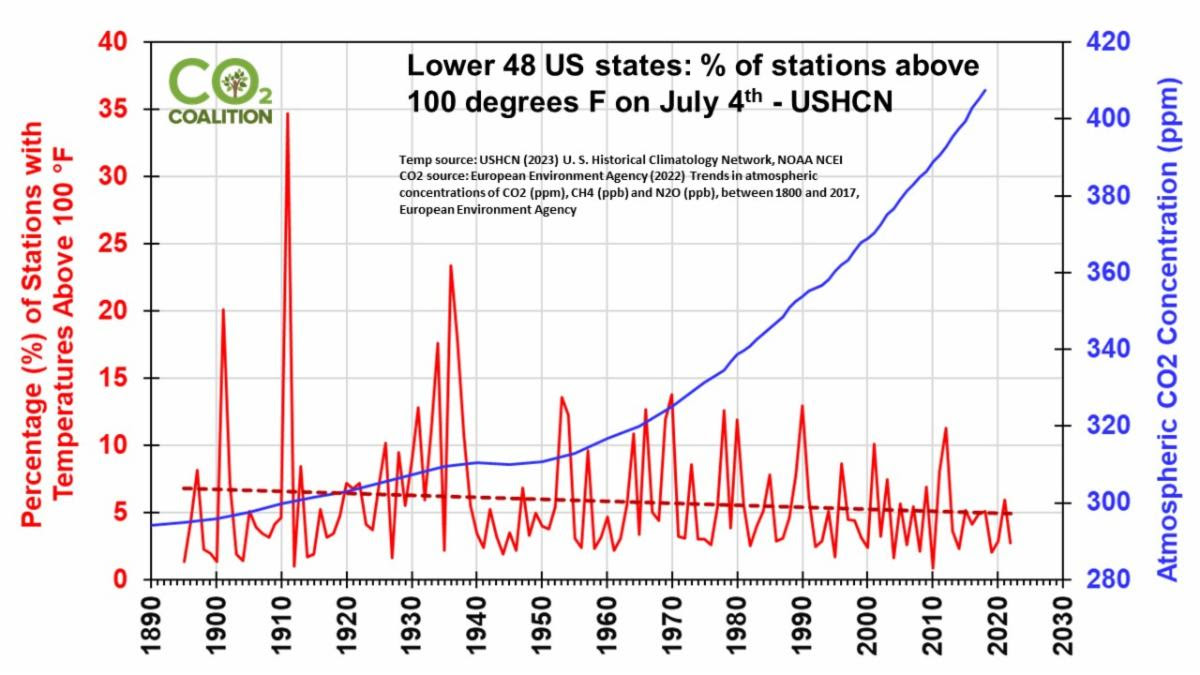
You may note that the blue lines depict CO2 concentration, but I would tend to discount that line for this analysis because CO2 measurements in the atmosphere did not begin until about 1958.
Jim is the chief meteorologist at mountainweather.com and has been forecasting the weather in Jackson Hole and the Teton Range for over 30 years.