All posts by Jim Woodmencey
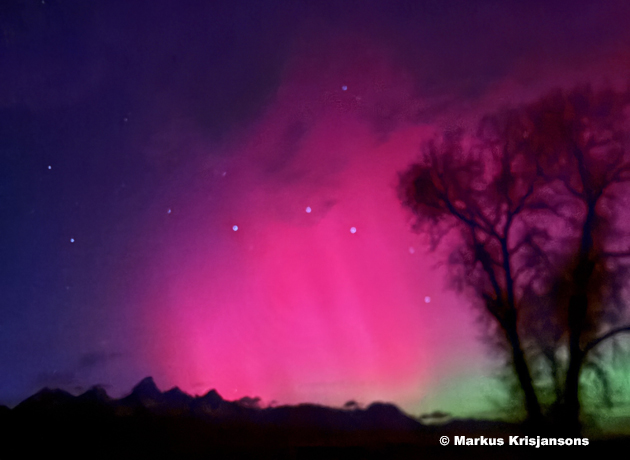
November 2025 Aurora
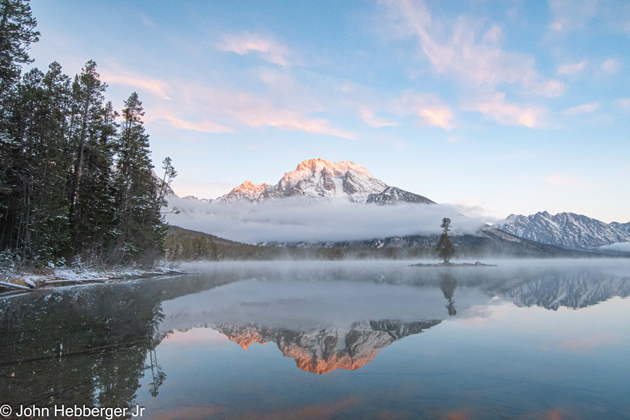
November Sunrise Leigh Lake
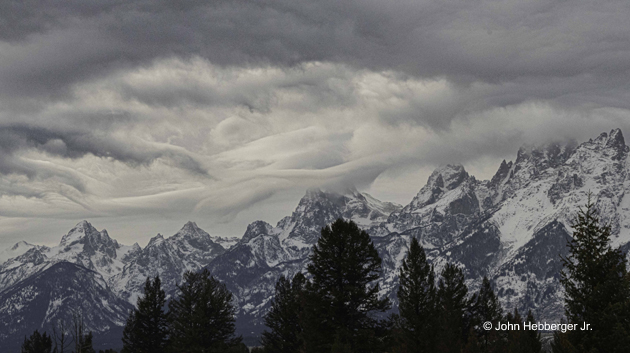
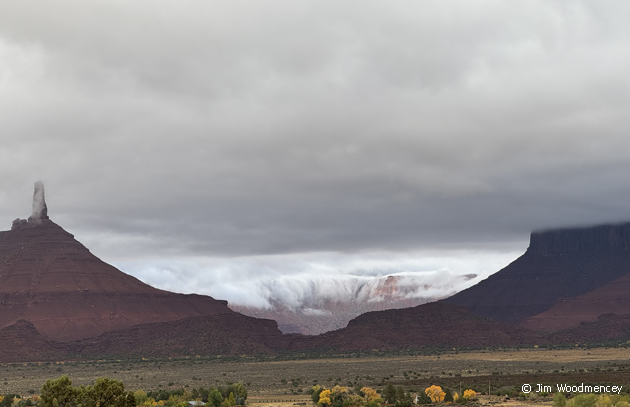
Castle Valley Clouds
Winter Outlook for 2025-26
Fall is upon us, with cooler temperatures and a little snow showing up in the mountains in early October. This is the time of year when our mindset begins making the transition from hiking, biking, boating, and fishing to thoughts of skiing, snowboarding, snow-machining, or heading south to a warmer climate.
Given the change in seasons, this would be a good time to take a gander at this winter’s weather outlook, to see what we might expect for precipitation and temperatures in the coming months.
NOAA’s Outlook
The long-range outlook from NOAA’s Climate Prediction Center for the northern half of Wyoming and for all of Montana during the main winter months, December 2025 through February 2026, shows precipitation is expected to be in the above normal category for that three-month period. (Maps from NOAA’s Seasonal Outlook page).
Looking at the next three-month outlook period, January 2026 through March 2026, the forecast is even more solidly in the above normal precipitation category for Wyoming, including Jackson Hole and eastern Idaho. That bodes well for us as far as our chances of a good snowfall winter.
Temperatures this winter for most of the northern and central Rockies, including Montana, Wyoming northern Utah and central Colorado shows no trend either way, warmer or colder. Temps are in the “Equal Chance” category. The Equal Chances category means that the odds are the same for having above normal, below normal, or normal temperatures this winter.
Click here for: How to Read the 3-Class Three Month Outlooks
Below is the forecast map for December-January-February. The map for January-February-March looks very similar.
For comparison, last year at around this same time, NOAA’s forecast was for “Equal Chances” for both precipitation and temperatures. Temperatures ended up above normal in December, February, and March in the Town of Jackson. While snowfall ended up above normal for those three months – and also for the whole winter – both in town and up in the mountains. January was the only month last winter with below normal temperatures and below normal snowfall.
ENSO Forecast
ENSO is acronym for the El Nino Southern Oscillation, which describes the state of sea-surface temperatures in the equatorial Pacific Ocean. El Nino is one phase of ENSO. Simply put, an El Nino is when sea surface temperatures in the Equatorial Pacific are warmer than normal. A La Nina is when those temperatures are colder than normal. Both El Nino and La Nina have some effect on the weather patterns that develop across the Pacific Ocean, primarily during the Northern Hemisphere’s winter season.
The common thinking is that an El Nino winter favors a more southern storm track across the Pacific, bringing above normal precipitation to California and the Sierras, as well as the Southwestern United States. La Nina winters favor more precipitation and snow over the northern tier of the United States, including Western Wyoming.
The latest ENSO forecast from October 9th, 2025 said: “La Niña conditions are present and favored to persist through December 2025 – February 2026, with a transition to ENSO-neutral likely in January-March 2026 (55% chance).
Be careful how much faith you put into ENSO forecasts. A recent study done in California showed that El Nino’s only produced above normal snowfall about 35-percent of the time. Therefore, the hype about El Nino that we have heard for the last 30 years may be a bit overdone. Same with La Nina’s in the northern tier, some La Nina years were very beneficial snowfall-wise, others were not.
Farmer’s Almanac
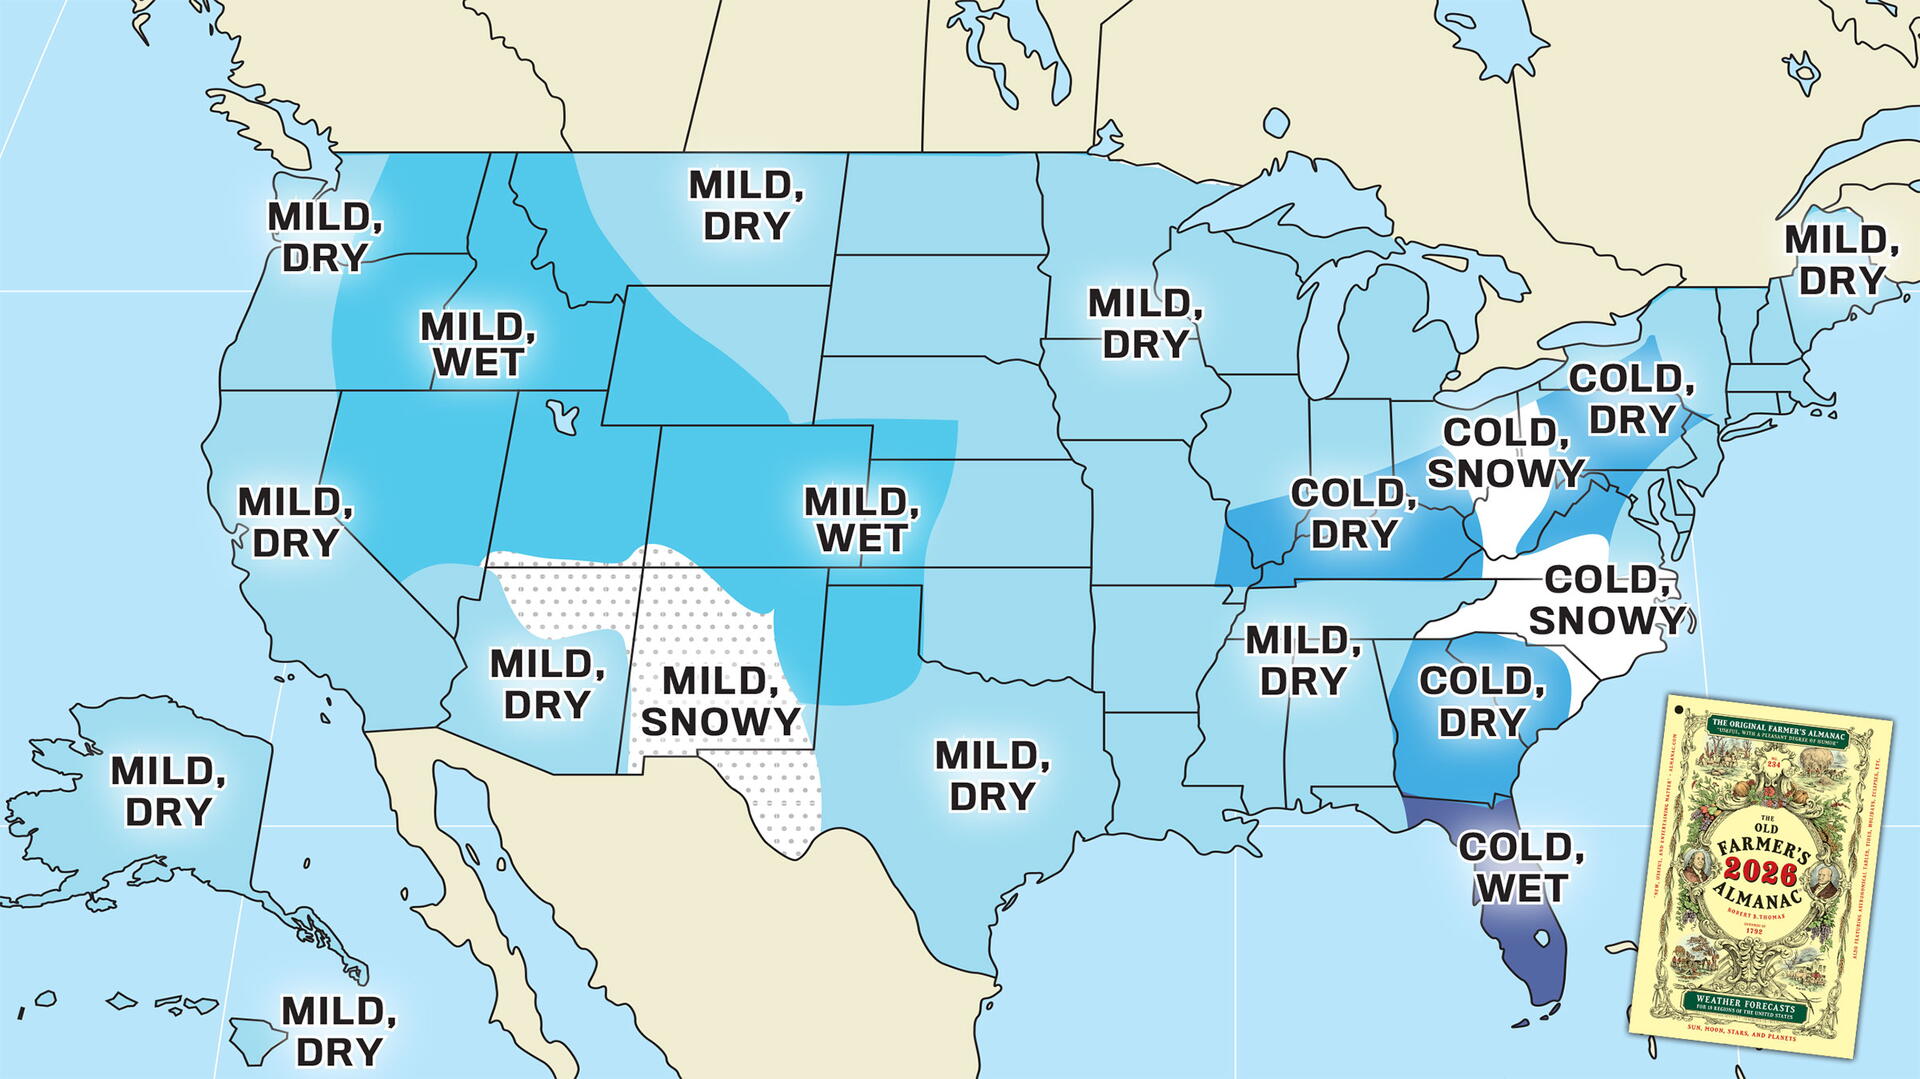
Now let’s review what the Farmers Almanacs have to say. There are two of them to look at, the Old Farmer’s Almanac and the Farmers’ Almanac.
The Old Farmer’s Almanac prediction, which has been around since 1792, calls for “Mild and Wet” conditions this winter for Wyoming, Idaho, Utah, and Colorado. And, “Mild and Dry” conditions for western Washington and Oregon, and all of California. Saying, “wet”, in the winter forecast would translate to more precipitation than normal, and thus more snow for the mountains, I’ll assume. Saying, “mild”, I suppose means temperatures will be near or just above normal.
The Farmers’ Almanac, which began its weather prognostications in 1818, has the most succinct forecast for the Rockies. They are calling for, “Very Cold and Snowy” conditions this winter for all of Montana, Wyoming, and Colorado.
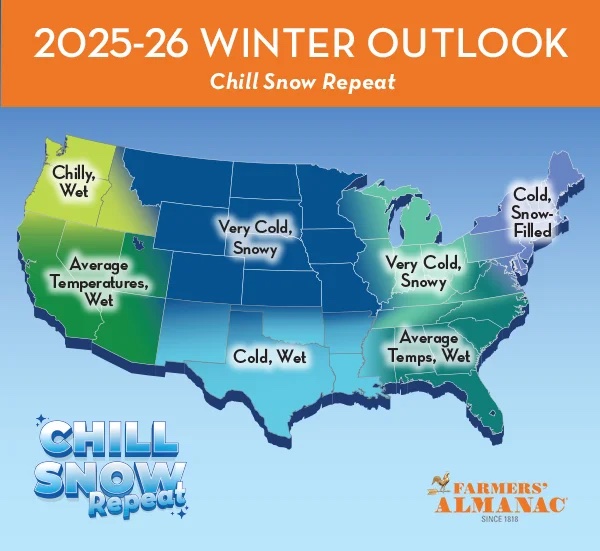
Bingo! That does it. It’s confirmed. All forecasts for this winter are leaning towards more precipitation, which must mean we’ll have more snow that average here in Jackson Hole, right?
Final Words
One last thing to consider, from a statistical perspective: In the last seven years there has only been one winter, the winter of 2021-22, that registered below average snowfall at the Jackson Hole Mountain Resort. Within the last seven years at JHMR, 5 of those winters ranked in the top-ten snowiest winters on record. Just three winters ago, in 2022-23, JHMR had their second snowiest winter ever. The question is, will this snowier than normal trend continue? Or, statistically speaking, are we due for a below average snowfall winter? The forecasts all say, “no”. Maybe it will be the next winter when the snowfall is leaner than normal.
______________________________________________________________________________
Post by Jim Woodmencey. Some of this text originally appeared in the Jackson Hole News and Guide, Mountain Weather column, on October 8th, 2025.
Jim is the chief meteorologist at mountainweather.com and has been forecasting the weather in Jackson Hole and the Teton Range for almost 35 years.
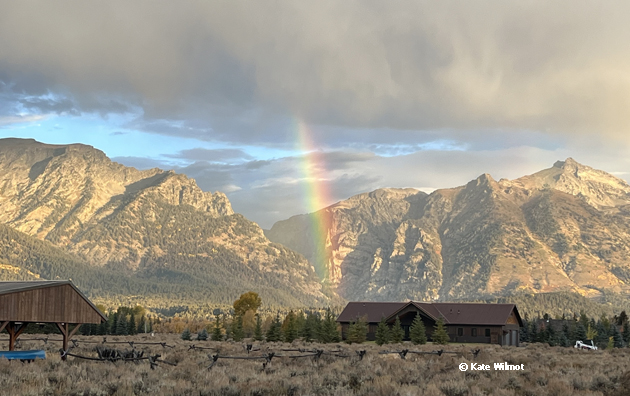
Fall Rainbow in the Tetons
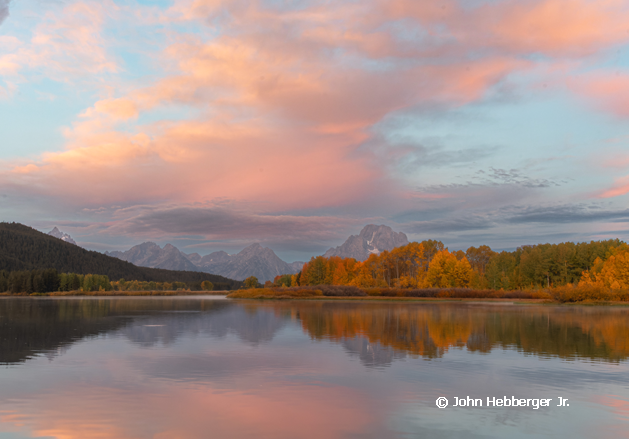
Oxbow Bend in Fall Color
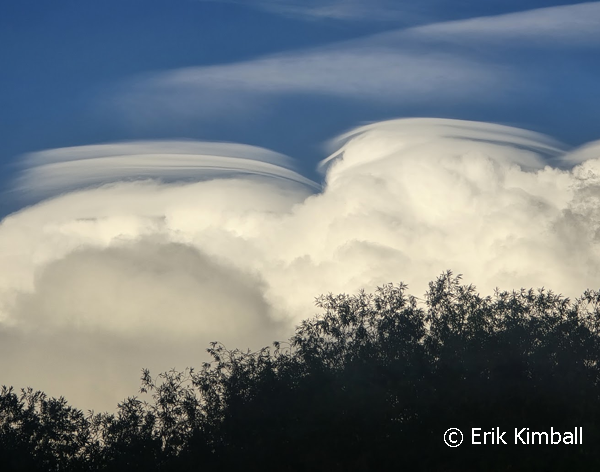
Cumulus Cap
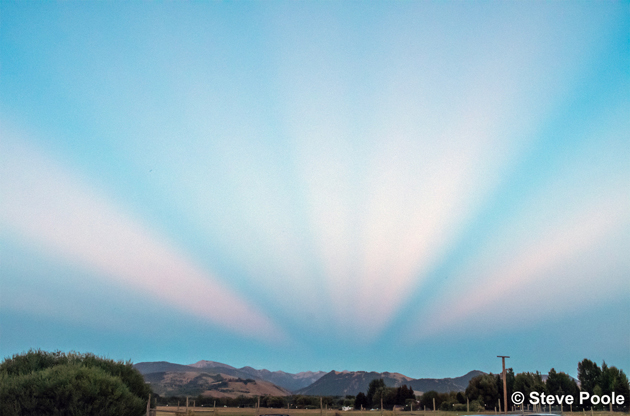
Crepuscular Rays
Are Wildfires Getting Worse?
The weather ultimately determines how bad our fire season will be. How dry, how hot, and for how long. Once fires do start, their size, intensity, and potential destruction will be determined by which way and how fast the wind blows.
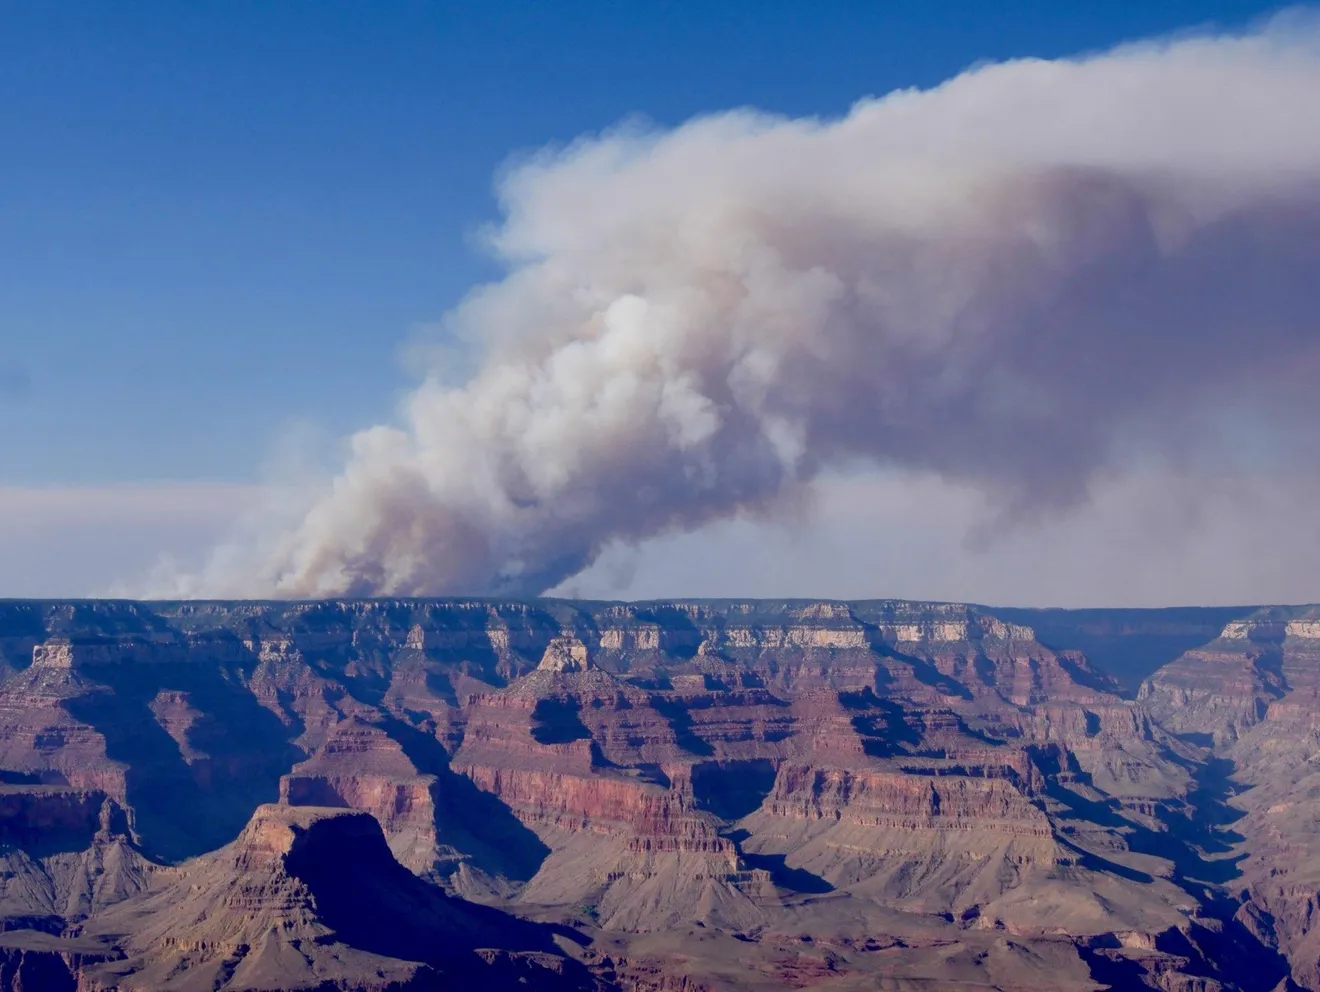
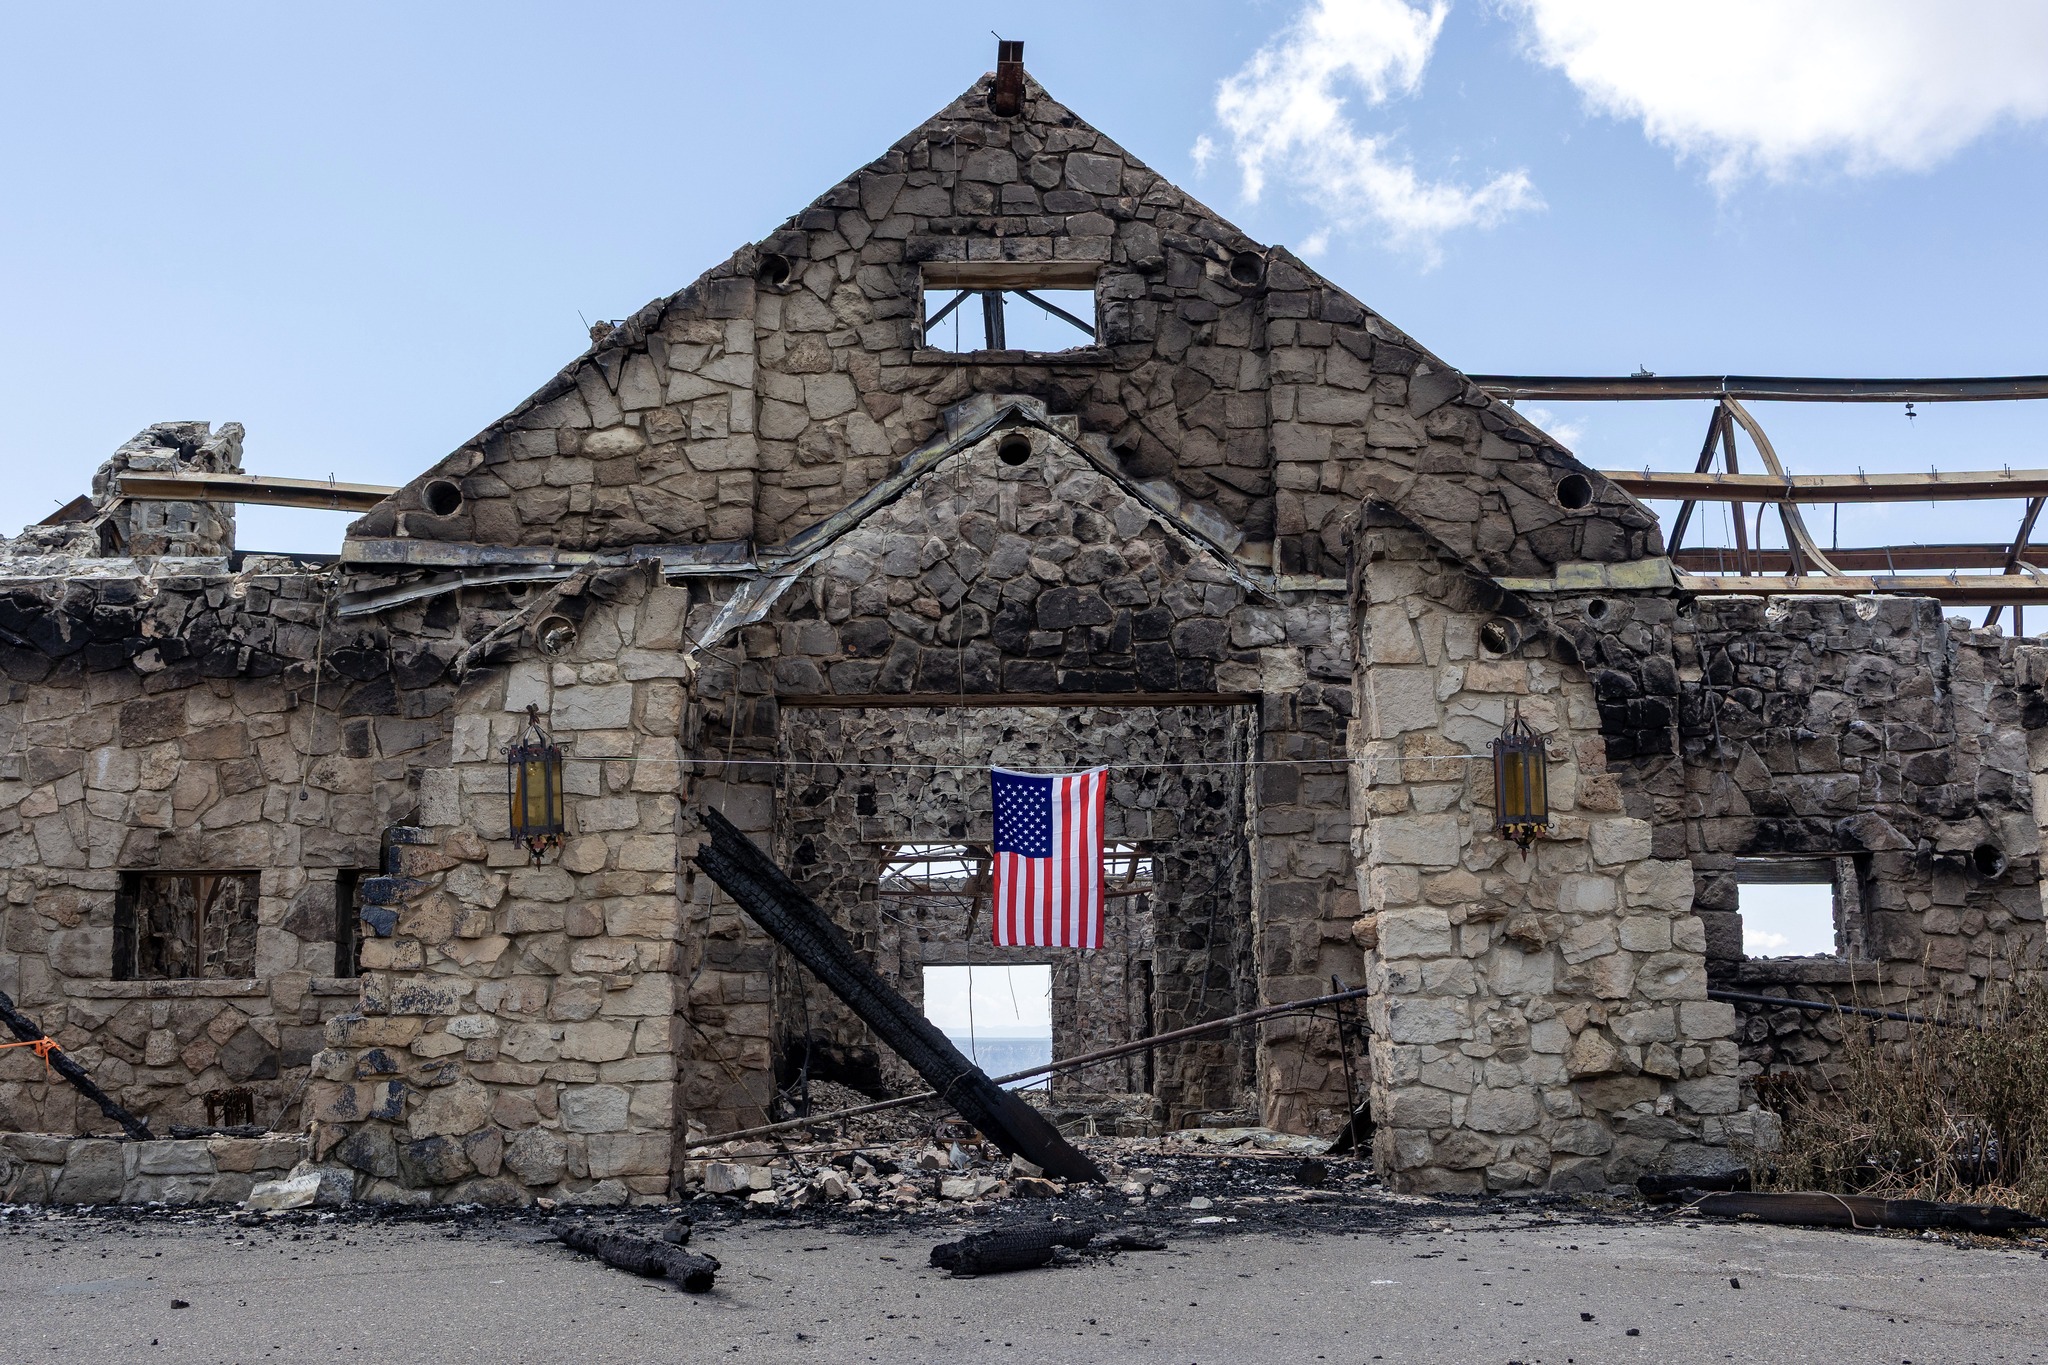
Two large fires that have currently been burning, one in southern Utah, and one in northern Arizona (the one that destroyed the historic lodge on the north rim of the Grand Canyon), were the result of a very dry winter and spring season, and warm and dry weather in June. Once ignited by lightning, these fires blew up and ran fast with increasing winds.
In this post, I’ll review the weather in Jackson, WY from this spring and early summer, which sets up our fire season going into August. I’ll also address the question, are wildfires getting worse?
Spring and early Summer Weather
This spring was wetter than normal here in Jackson. Monthly data from the Jackson Climate Station showed a total of 5.42 inches of precipitation in March, April, and May of 2025. That’s 130-percent of the long-term average precipitation for those three months of 4.17 inches. A wet spring allows vegetation on the ground to grow taller.
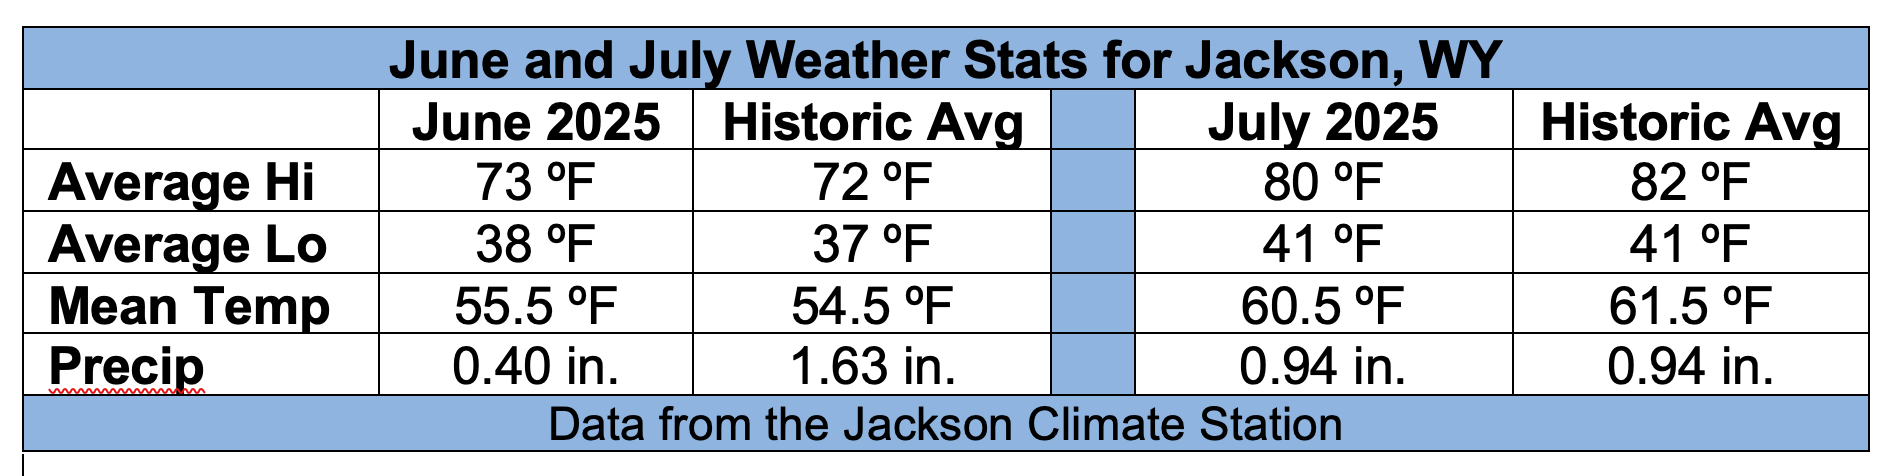
June 2025 checked-in with below normal precipitation, and slightly warmer than normal temperatures. June’s total precipitation was only 0.40 inches in town, compared to the average of 1.63 inches. June’s temperatures were one degree warmer than the long-term average.
July 2025 precipitation was normal, with a total of 0.94 inches, which is exactly what Jackson’s long-term average precipitation is for July. Even though many people complained how hot it was this July, Jackson ended up one degree cooler than the long-term average. The average high temperature in July 2025 was 80 degrees, or two degrees below the average of 82 degrees. The average low was 41 degrees, which is right at average for July.
Total precipitation in town for June and July was 1.34 inches, which is only 52-percent of the average precipitation of 2.57 inches for those two months. That leaves us where we are today, with a wet spring and a dry early summer. Not an ideal set-up going into August, as far as wildfires are concerned. Despite the lack of precipitation the last two months, the hillsides are still pretty green around the Jackson Hole area in early August.
Wildfire Stats and History
Nearly every news story I read these days about wildfires quotes the same line, that “wildfires are getting worse and are becoming more frequent”. You can do a search on the Internet asking, “are wildfires getting worse”, and you will find numerous articles confirming that wildfires are burning more acres now than they were back in the early 1980’s. However, none of these articles are telling the whole story.
On March 1st of 2021 the National Interagency Fire Center (NIFC) website removed all wildfire data prior to 1983. NIFC stated that prior to 1983, the sources of fire data could not be confirmed and were not derived from the current reporting process. That is just a little suspicious, since those numbers had been available from NIFC for decades.
The government began keeping track of the number of wildfires and the number of acres burned each year starting in 1926. The graph provided is from the National Interagency Fire Center, it shows the complete history of the number of acres burned each year in the United States, from 1926 through 2019. I had saved a copy of this prior to it’s deletion.
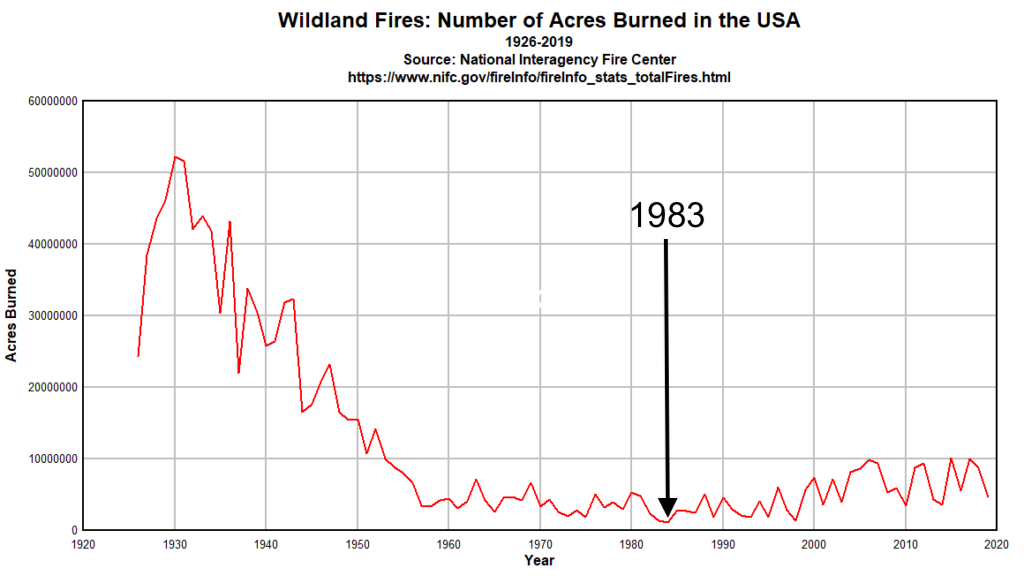
NIFC’s data now starts in the early 1980’s, with 1983 and 1984 being the two lowest years on record for number of acres burned. Since the mid 1980’s the number of acres burned has increased over the last 40 years. However, prior to the mid 1950’s wildfires were much worse than they are today.
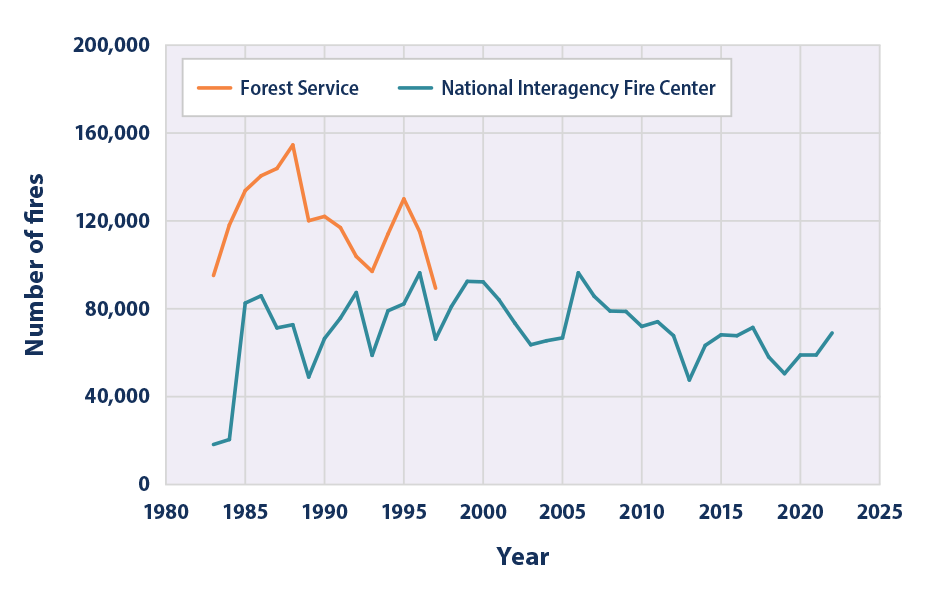
It may also be worth noting that the frequency of wildfires, that is, the number of fires per year, has been steady, or even dropped a little since the mid-1980’s to early 2000’s. The graph below, also from NIFC’s database, shows the number of fires each year, since 1983. The blue line is NIFC data, the orange line is from Forest Service estimates, which stopped in 1998.
The Complete History
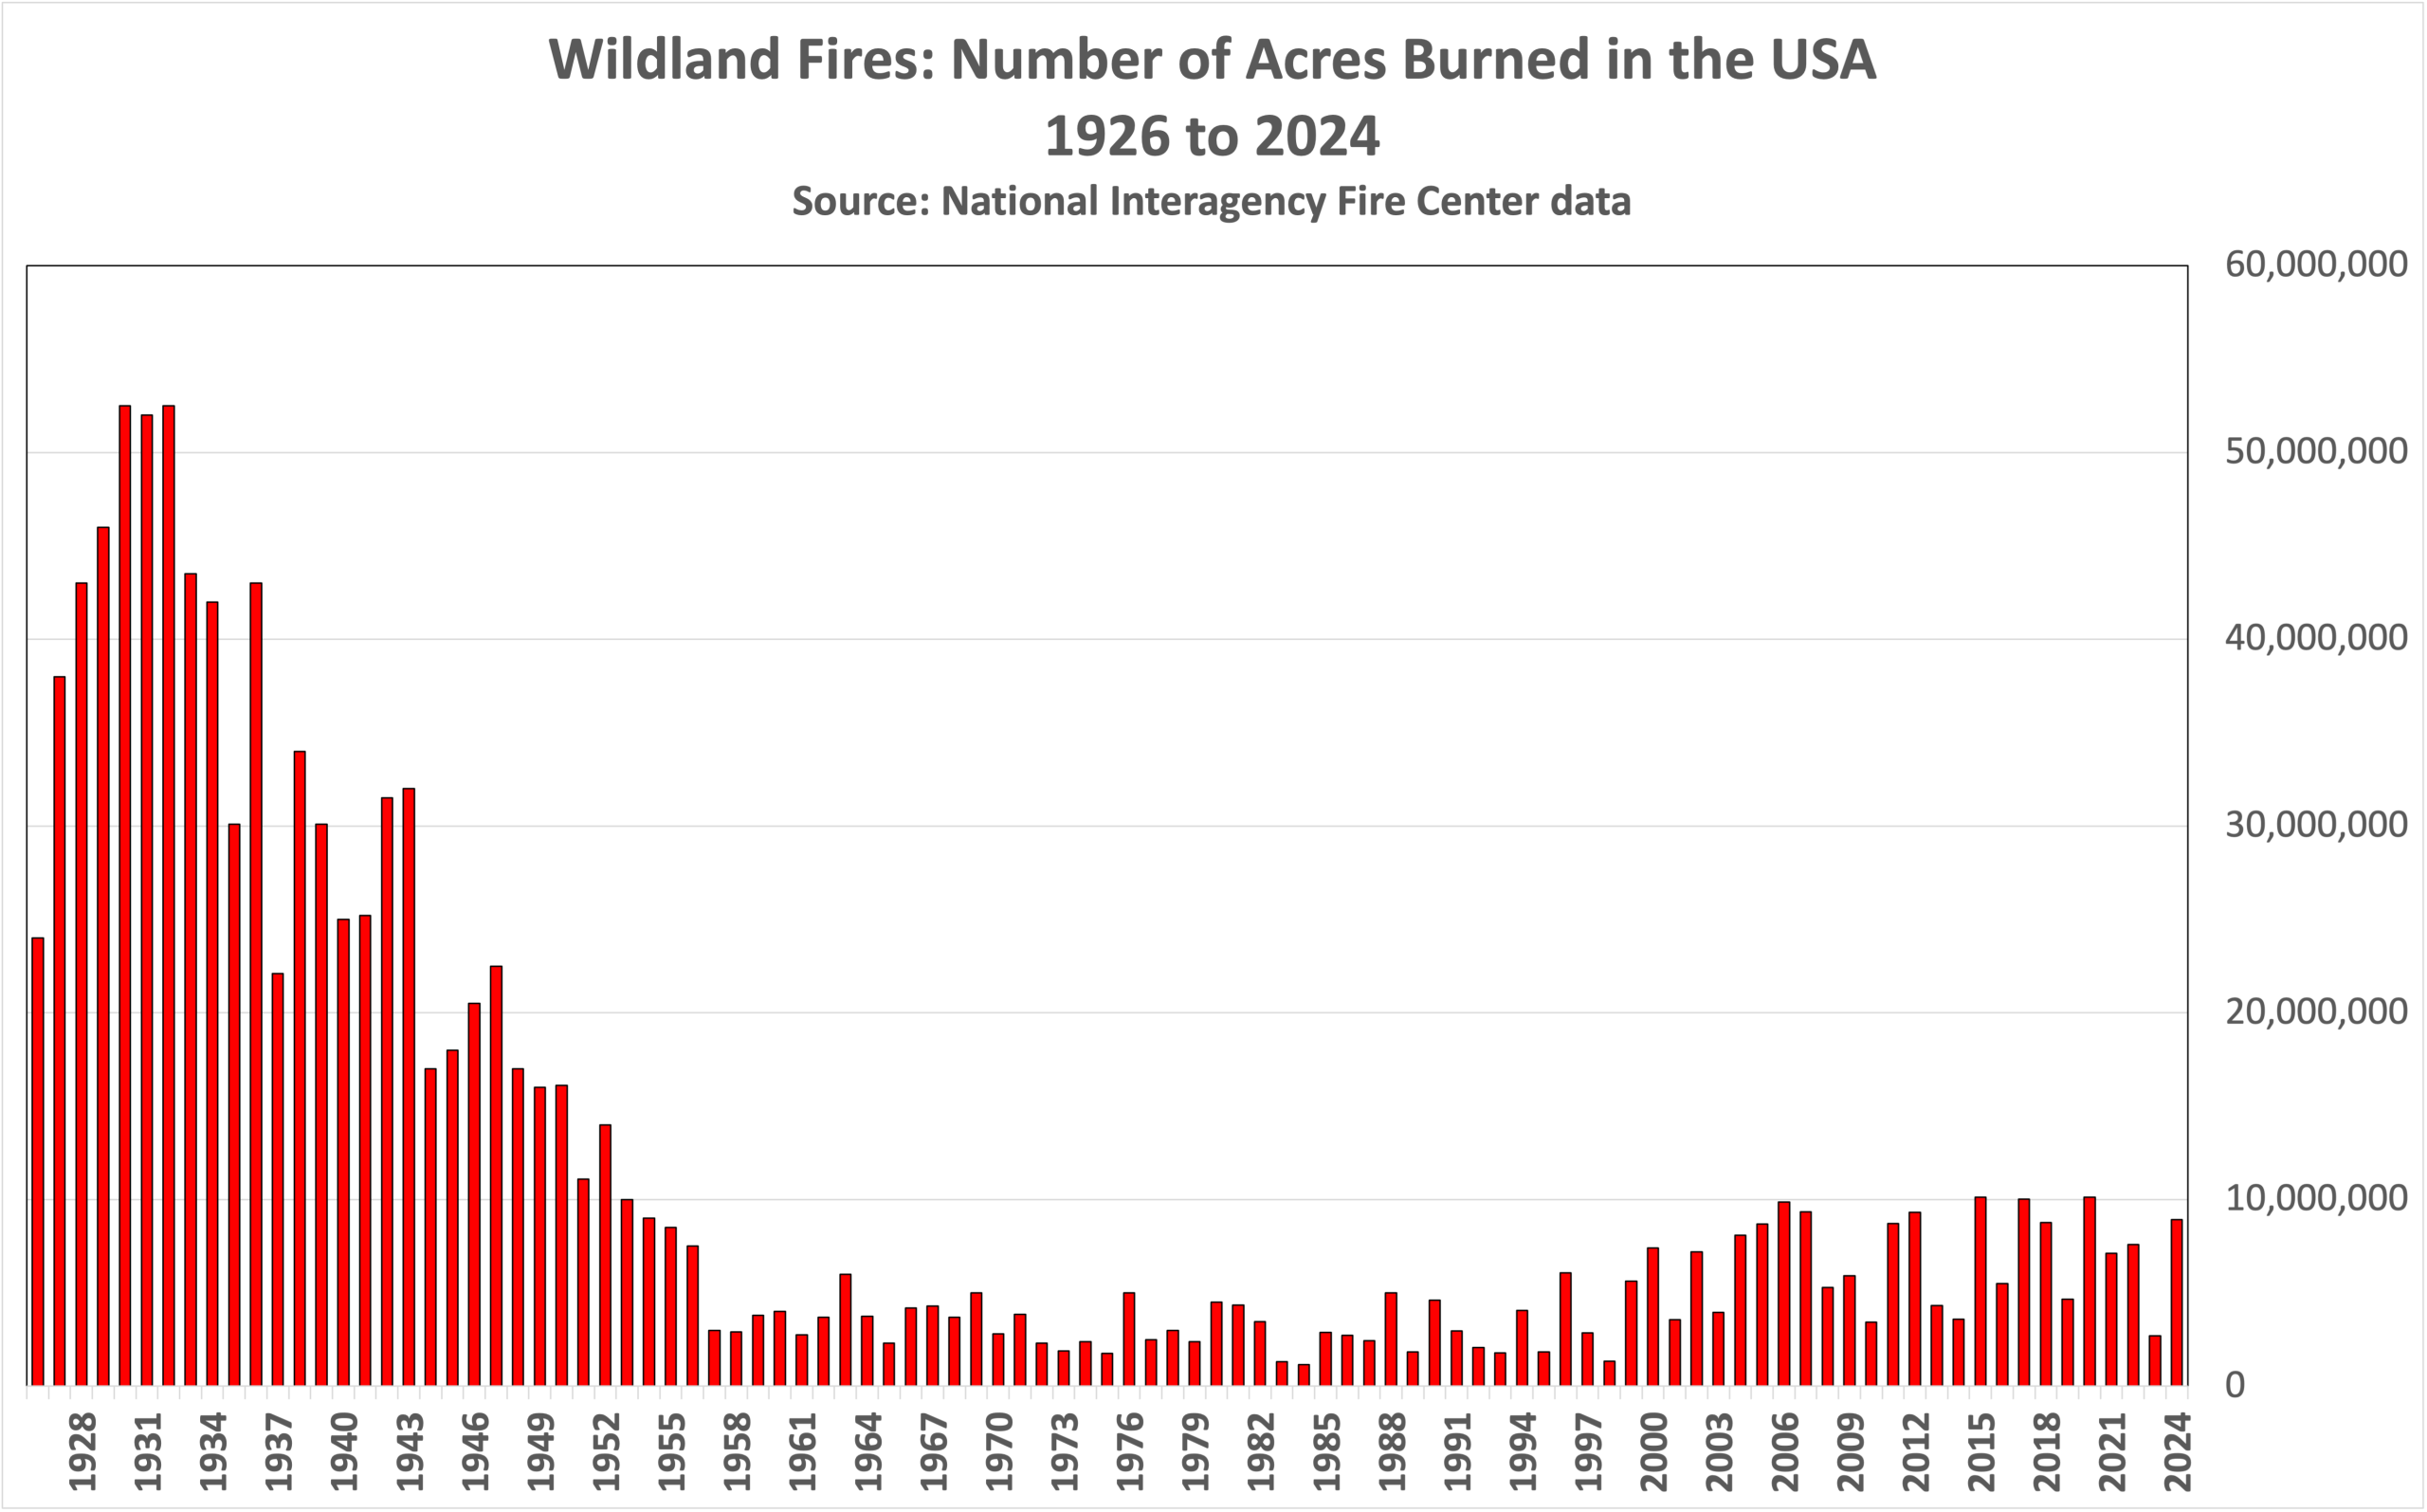
To show the complete history, I compiled a graph of all the data on acres burned each year, from NIFC’s old and new databases for the last 99 years, from 1926 to 2024. Here it is plain to see that from the mid-1920’s to mid-1950’s tens of millions more acres burned each year in the United States than have burned in the latest 20 years. The U.S. topped 10 million acres burned in a year only 3 times in the last 10 years. Between 1926 and 1952, every single year topped 10 million acres. In 14 out of those 26 years, more than 30 million acres burned each year!
Fire Suppression
Two other factors have helped shape these statistics, first is that prior to the early 1950’s very little fire suppression was being done and wildfires were pretty much left to burn in the wilds. As the size of the Wildland Urban Interface grew through the 1990’s, with population and development in forested areas, more aggressive fire suppression was implemented to avoid wildfires getting out of control and causing damage to homes and infrastructure. This caused a massive interruption in the natural fire process for creating healthy forests.
Since the 1990’s a more balanced approach between letting it burn and full suppression has been adopted. However, occasionally fires that we try to contain will get out of our control.
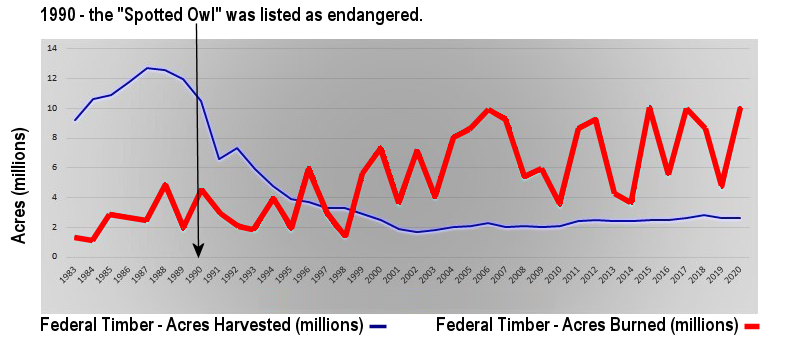
The second factor shaping the stats, is the decrease in the number of acres of timber being harvested each year. The graph below shows acres of timber harvested vs.acres burned, since 1983 through 2020. Don’t blame the Spotted Owl for the uptick in acres burned, but certainly fewer acres of forest harvested makes more acres available to burn.
Current and Last Season Fires
According to NIFC, as of August 1st, 2025, there have been 40,945 wildfire incidents, and over 3.2 million acres burned. The average number of incidents per year, since 1983, is 69,540 and the number of acres burned per year is about 5.2 million acres. According to NIFC, despite a few large fires this season, so far, fewer square miles have burned this year than average.
In 2024, there were 64,897 fires that burned a total of 8.9 million acres. Of those fires, lightning started 6,935 of them, burning over 4.2 million acres. Humans caused 57,962 fires, burning just almost 4.7 million acres.
Lightning caused fires will be left to burn, if in a remote enough area. Human caused fires are usually extinguished, especially if there is any threat to homes or infrastructure.
The loss of the structures on the North Rim of the Grand Canyon is a good example of a natural fire, started by lightning, that was let to burn in an uninhabited area to improve forest health. But a shift in wind direction and an increase in speed quickly turned that story into a horrific loss of ranger residences and the Grand Canyon Lodge.
Look Beyond a Single Cause
Decide for yourself if you think wildfires are getting worse or more frequent. But the data in no way suggests that. By taking a more comprehensive look at our wildfire and forest management history more accurate story can be told than the narrative the media hypes these days. It would seem that everything disastrous that happens with the weather anymore is a result of climate change. That is ostensibly a very narrow view of of a much more complex subject. When it comes to wildfires there are a multitude of factors involved.
Post by meteorologist Jim Woodmencey