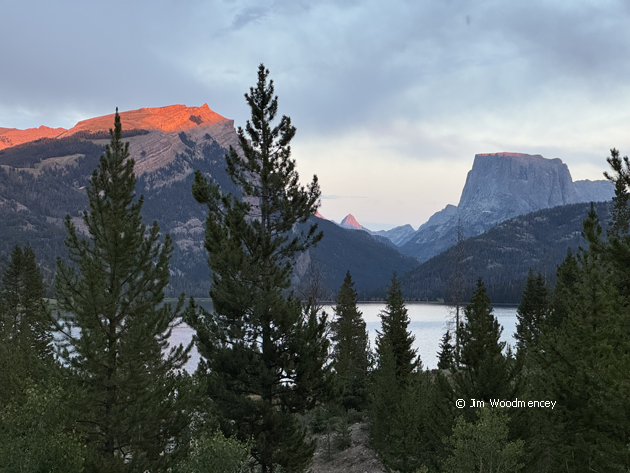
All posts by Jim Woodmencey
Mammatus clouds
Thunderstorms and Lightning Safety
In the summer months a good portion of our precipitation here in Jackson Hole, and throughout most of the Mountain West will be produced by thunderstorms. So, to help you avoid being caught out in a thunderstorm, and its associated lightning, I’ll give you a few hints on what to watch for in the sky, along with a few simple weather products to consult each day.
Typical Thunderstorms
Even on those days that begin with clear blue skies, puffy cumulus clouds can appear in the afternoon. These are caused by convection, or the afternoon heating of the ground that causes air to rise. Heating the ground causes the atmosphere to become unstable.
As the air rises higher into the atmosphere, it cools. Whatever moisture that is contained in the atmosphere, in the form of invisible water vapor, is then condensed into water droplets, water droplets coalesce together to form clouds.
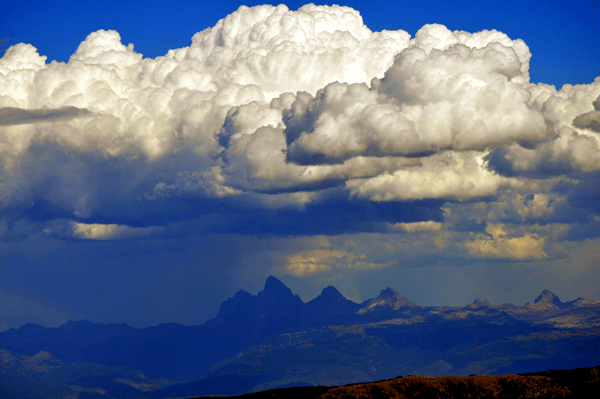
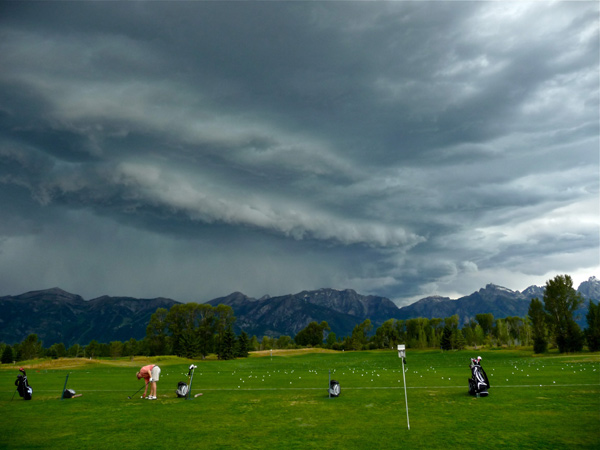
If there is enough moisture and instability in the atmosphere, then those harmless, puffy, cotton ball-looking clouds might appear around noontime. By mid to late afternoon, they may grow into full-blown thunderstorms. If there is not enough moisture or instability in the atmosphere, then all we’ll see are harmless puffy clouds.
Clouds that Grow and Gather
Here are a few things to watch for to determine if those puffy clouds are going to develop into thunderstorms:
1) The first puffs of cumulus appear before noontime.
2) Cumulus clouds growing taller and begin gathering together.
3) The bases of the clouds get progressively darker, an indication that the clouds are growing taller.
4) The taller the cloud, the darker the bases, and the larger the area that the cumulus clouds cover, and thus the greater the potential for thunderstorms.
That is the progression of typical afternoon thunderstorms. However, thunderstorms do not only develop during the afternoon hours, there will be plenty of days that don’t fit this more typical pattern.
Untypical Thunderstorms
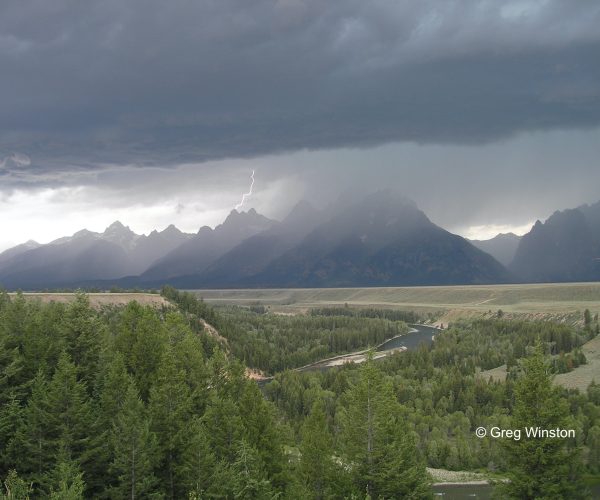
Storm systems, otherwise known as low-pressure systems, periodically roll across the Rockies during the summer months. Storm systems not only bring additional moisture and instability, but they also provide extra lift to the atmosphere, giving an extra boost to the vertical motion that allows thunderstorms to blossom.
Cold fronts are usually associated with low-pressure systems. Cold fronts are very efficient at providing extra lift in the atmosphere. When a cold front is passing through, more intense thunderstorms are always likely.
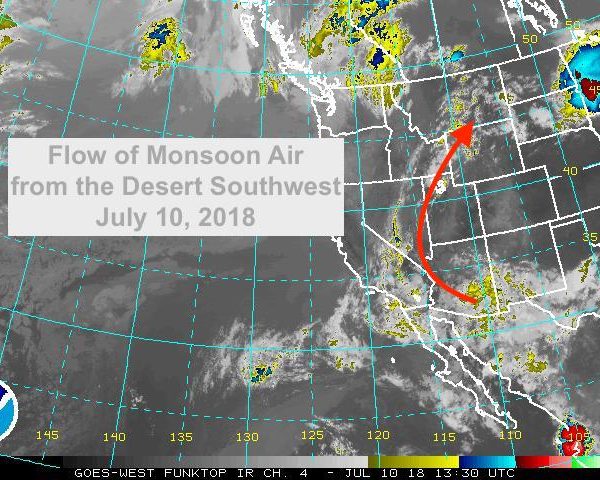
The last thing to be on the lookout for, is the summer monsoon. The Desert Southwest Monsoon is a seasonal wind flow pattern that brings very moist and unstable air up from central Mexico to the Four-Corners Region. Periodically, some of that moisture reaches as far north as Northwest Wyoming.
The important point to make here is, a low-pressure system, a cold front passing through, or monsoon moisture are each capable of generating thunderstorms at any time of the day or night.
Check the Forecast and Maps
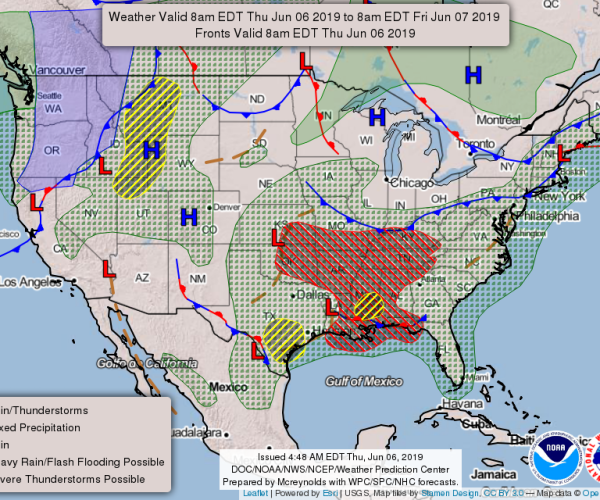
Check the forecast each day to see if there is any mention of thunderstorms, even a small probability, like a 20-percent chance can be significant. A thunderstorm automatically implies the potential for lightning and may also portend a potential for heavy downpours of rain, or hail, or strong gusty winds. Also check the daily forecast weather map to see if there are any fronts nearby.
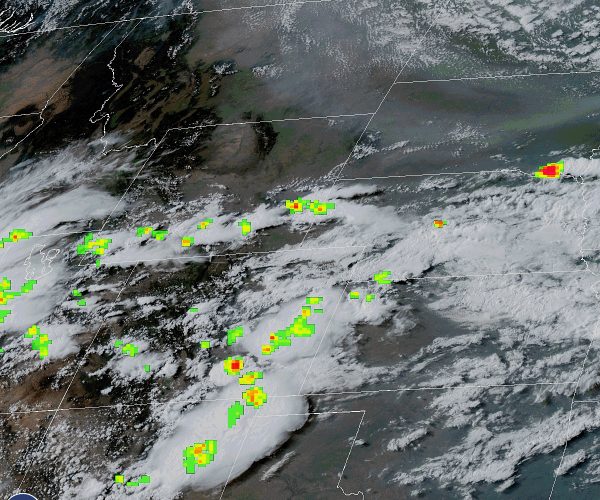
There are two other tools you can use for short term forecasting, to see if there is any lightning occurring nearby or upstream of your location. One is a Lightning Strike Map, the other is the GeoColor Satellite image with lightning flashes. Both products are available on the Satellite and Radar page of mountainweather.com
Keeping an eye out for developing thunderstorms is the first step to staying safe in the outdoors this summer. Nest we’ll look at some lightning safety tips and what you can do to reduce your chances of getting zapped if you do get caught out in a thunderstorm.
Lightning Safety
It’s always a crapshoot trying to forecast precisely when and where lightning will strike. Here I’ll share some facts about lightning and how to evade getting zapped in case you do find yourself unable to get to a completely safe location.
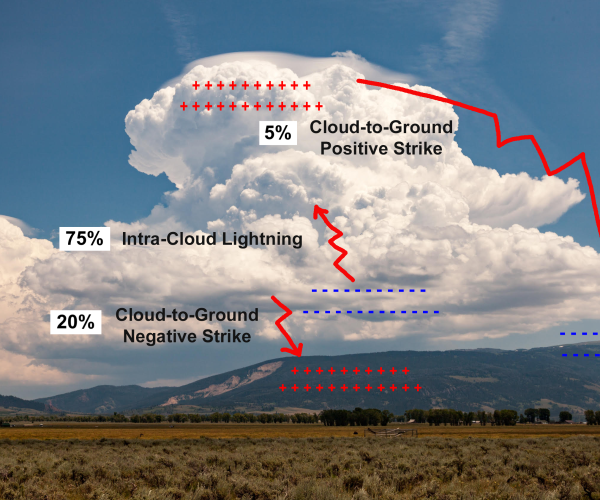
First thing is, most of the lightning that occurs with a thunderstorm stays in the cloud. About 75% of all lightning occurs within the cloud, only 25% of lightning produced in a thunderstorm with strike the ground. But those intra-cloud lightning flashes are a good indicator that ground strikes may be eminent.
How Lightning Can Hurt You
A single lightning bolt generates up to around 100 million volts of electricity, for a split second. During that split second, the temperature of a lightning bolt can reach 54,000-degrees Fahrenheit, which is about five times hotter than the temperature of the sun. There are a several ways that the electrical energy and heat from lightning can hurt you.
First, is being hit by a “Direct Strike”. The odds of this are very small, however, if you were unlucky enough to take a direct hit, it would be game-over, right then and there.
Second, would be through “Conduction”. Electrical energy travels through all metal objects, but also through graphite, carbon-fiber, and water. During electrical storms you should avoid direct contact with wire or chain-link fences, your fishing pole, hiking poles, tent poles, your bicycle or boat. Think of sticking your finger in a light socket, multiplied by about one-million times.
The third method by which lighting can hurt you is from what is known as “Side-flash”. The heat & electrical current that emanates outward through the air from a nearby lightning strike is intense enough to can cause cardiac arrest, concussive injuries, severe burns, and/or nerve damage.
Lastly, and the most common way of being hurt by lightning, is through “Ground Currents”. When lightning strikes the ground, the electrical current is carried outward, radially, in all directions through the ground. If that current reaches you it can travel up through your body, doing damage to vital organs. Cardiac arrest, burns, and severe nerve damage are also possible via ground current.
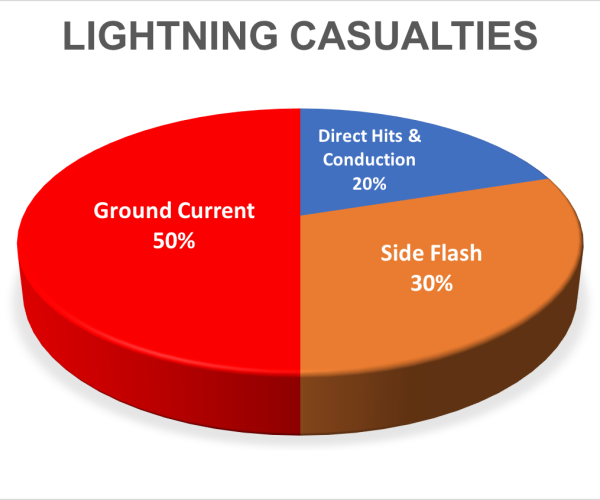
Direct strikes and conduction account for about 20-percent of all lightning casualties. Side-flash accounts for about 30-percent of injuries and fatalities. Ground currents alone account for the other 50-percent of all lightning injuries and fatalities.
Safe Havens from Lightning
The safest place to be during a thunderstorm is in a building or a car. A “building” means a 4-walled structure with a foundation and grounded electrical and plumbing. A picnic shelter or large tent may keep you out of the rain, but your lightning exposure is the same as standing out in the open.
A vehicle is the next best safe have. Contrary to what you might think, it is not the tires on your car that insulate you from te electrical current, it is the metal frame and body of the car that dissipate the electrical energy around you. A motorcycle or bicycle do not offer this same “halo” of protection.
If there is not a building or car to retreat to, get to lower ground. Get off any ridgetops. A study done in Colorado showed that lightning strikes the ridgetops 7 times more often than adjacent valleys.
You should also get off the water if you are on a lake or river. If you can, get to a grove of trees that are of similar height to wait it out. Do not run for the biggest, lone tree to get out of the rain. As soon as you can see lightning or hear thunder, you should be looking to seek shelter immediately.
There is not much we can do to protect ourselves from a direct hit or a side-flash. Conduction is something we can protect ourselves from, by not being in contact with any objects that can conduct electricity, including water. Be aware, that even other people can conduct electricity, like when standing in a crowd.
Don’t Huddle-up
Lightning that strikes nearby will generate intense heat and electricity. Think of a lightning bolt like a hand grenade. The standard U.S. Army grenade has a kill radius of around 25 feet and a casualty (injury) radius of roughly 50-feet. A group of people, standing close together, will result in more casualties.
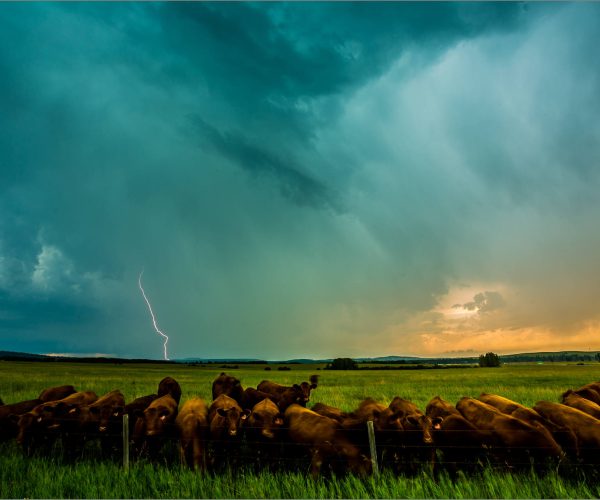
Sheep & cattle often die in large groups after a single lightning bolt hits nearby because they group together. Sometimes, lining up along a wire fence.
When lightning is present, don’t huddle together. Instead, spread out 25 to 50 feet apart. That way, if someone does go down after the explosion, others in the group can give aid.
If you find yourself outside with no good place to hide when lightning is visibly nearby, then you can reduce your chances of injury from ground current by just standing still with both feet together. The current that travels through the ground will take the path of least resistance and can go up one leg, through your body and exit out the other leg. By keeping your feet together, you might take a bump from the ground current, but your vital organs will be spared, hopefully.
Sitting Indian style on the ground with your legs crossed is also acceptable. Lying down, like in a tent for instance, is not acceptable, as too many different parts of your body are contacting the ground. And by the way, that camp pad does not insulate you from ground currents.
In Summary, if you can’t, “Get indoors when thunder roars”, as the National Weather Service slogan says, then:
1) Get to the best un-exposed location you can.
2) Get away from any metal objects.
3) Spread everyone in your group at least 25 feet apart.
4) Stand with both feet together and wait it out.
Post by meteorologist Jim Woodmencey
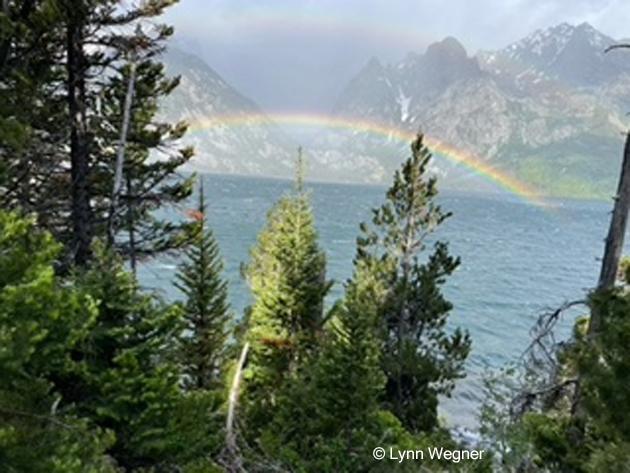
Rainbow Jenny Lake
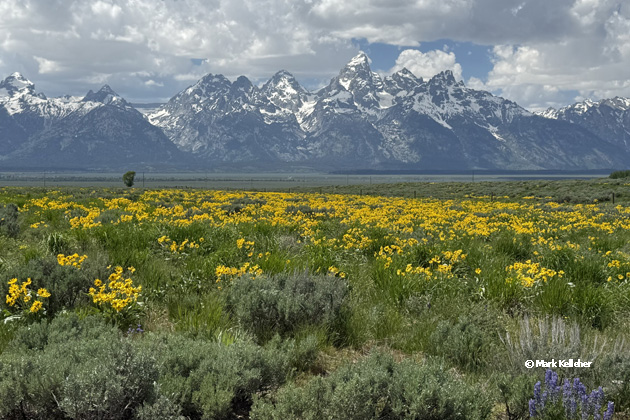
Springtime Tetons
Winter 2024-25 in Review
I know it’s the time of year when everyone is thinking about spring and eager for warm and sunny weather, but it is also time to do my recap of the winter season. In this week’s column, I’ll review Jackson’s weather from December through March, to see how this winter compared to last winter and to the long-term averages.
If you want the short story, Winter 2024-25 was snowier and wetter than normal and overall, temperatures were warmer than normal in town this past winter. The mountains also had above average snowfall again this winter.
Town Snow and Water
December of 2024 started out with above average snowfall in town, yet below average precipitation. The Town of Jackson Climate Station recorded 30 inches of snowfall for the month and 1.23 inches of water in that snow. That is a big disparity, especially when considering that most of that snow fell at relatively warm temperatures. I suspect some of the precipitation, or the water content of that snow, was missed or mis-read. Nevertheless, snowfall in December was well above the long-term historic average of 17 inches. The water content was below the average of 1.52 inches.
January 2025 was the driest month of this past winter, with only 4.2 inches of snow recorded in town and only 0.36 inches of water in that snow. Compared to the historic average of 19 inches of snow in January, along with 1.50 inches of water.
February kicked in with well above normal snowfall and water content in town. February 2025 saw 25.2 inches of snowfall in town, with 2.60 inches of water. Compared with the average for February of 14 inches of snowfall and 1.14 inches of water.
March added another 21.2 inches of snowfall and 2.21 inches of water. Compared to the average in March of 11 inches of snowfall and 1.23 inches of water.
Total snowfall for the four months was 80.6 inches, well above the long-term average winter snowfall of 61 inches in town. The total water content this winter was 6.4 inches, compared to an average winter amount of 5.39 inches.
The previous winter, 2023-24, the Town of Jackson had a total of 96.2 inches of snowfall and 7.11 inches of water. That winter started out with a dry December, a snowier than normal January, followed by a big February and record-breaking March snowfall in town.

Temperatures and Snow Depths
January was the only month this winter that was colder than the long-term averages, it was 6 degrees colder than the average mean temperature in January. December was 5 degrees warmer than average; February was 4 degrees warmer, and March was 2 degrees warmer than average.
What we observed this winter was that each snowstorm was usually followed by a warmup, or some rain in the valley. This prevented that snowfall from accumulating to any great depth over time. This winter the maximum snow depth at the Jackson Climate Station reached 15 inches on February 14th, 2025. Oddly enough, historically the average snow depth on that date is 14.5 inches and the average maximum snow depth in the winter is 15 inches in town.
Our perceptions of how much snow should be on the ground in town during the winter may have become a little skewed because of the depths we have seen in recent winters.
Last winter the maximum snow depth reached 32 inches on March 4th, 2024, which tied the record for that date. The winter before that, 2022-23, the maximum snow depth in town was 34 inches on March 11th, 2023, which broke the record for that date.
And, it’s no surprise that there is little to no snow on the ground at the Jackson Climate Station by mid-April, the long-term average snow depth by April 15th is less than half an inch.
Mountain Snow
Snowfall in the mountains this winter, from December through March, ended up above average and was just a little more than the snowfall total from the previous season.
The Rendezvous Bowl study plot at around the 9,600-foot elevation at the Jackson Hole Mountain Resort tallied 365 inches for the four months, December 2024 through March 2025. The previous season, 2023-24 had 359 inches. This season and last season were both above the long-term average at the Rendezvous Bowl site of 311 inches, for that four-month period.

Settled snow depths at the Rendezvous Bowl site on April 1st this year were very similar to last year, on April 1st, 2025, the snowpack measured 114 inches deep. On April 1st, 2024, it was at 116 inches. The average snow depth at Rendezvous Bowl on April 1st is 104 inches.
This now marks three seasons in a row with above average winter snowfall in both the mountains and the valley.
Post by meteorologist Jim Woodmencey.
Content originally appeared in the Jackson Hole News & Guide on April 16th, 2025.
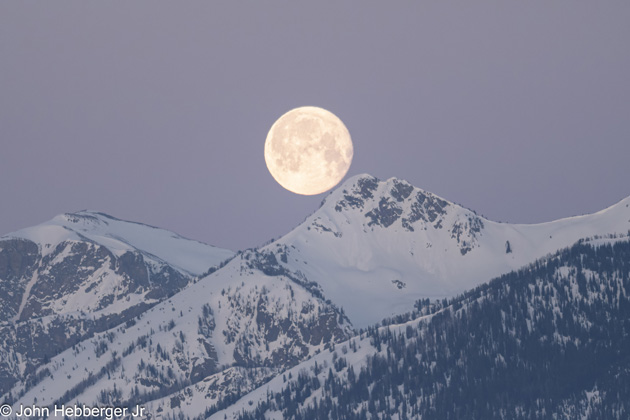
April’s Micro-moon
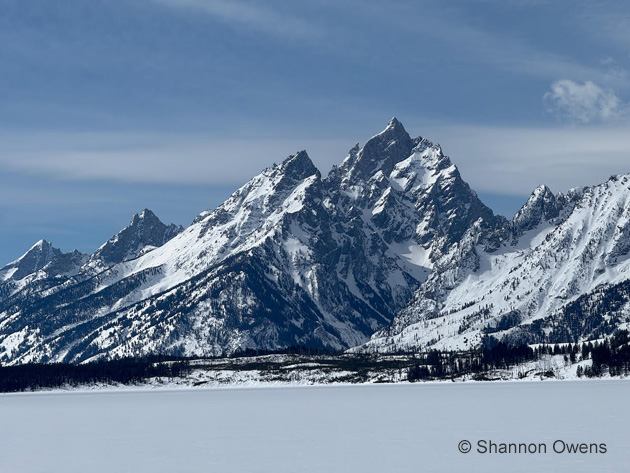
Cathedral Group
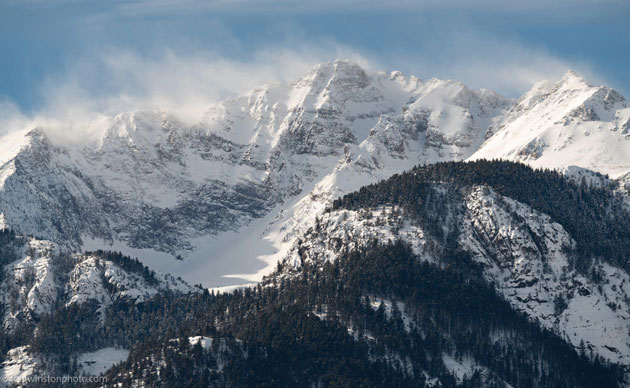
Electric Peak
First Half of the Winter 2024-25 for Jackson Hole
Sunday, February 2, 2025, was Groundhog’s Day. The real significance of this day is that it marks the halfway point of our astronomical winter season. It’s been six weeks since the Winter Solstice in December and there are still six more weeks until we reach the Spring Equinox in March.
This is also roughly the halfway point of our traditional ski season, between December 1st and April 1st. In this Post I will look back at the weather stats from December 2024 and January 2025 to see how this winter compares, so far, to the averages, and to the first half of last winter.
Town Snow
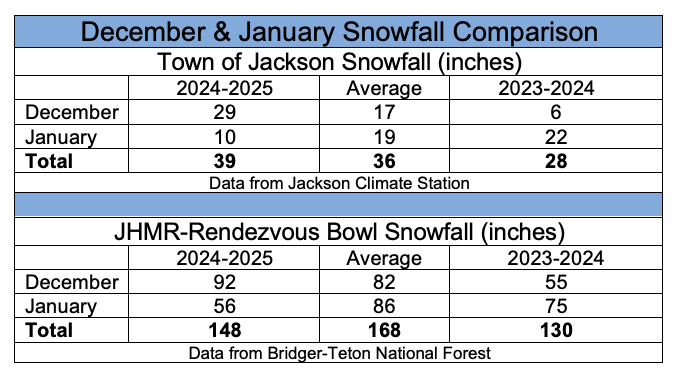
In December of 2024 the Jackson Climate Station recorded 28.8 inches of snowfall in town for the month. That’s nearly a foot more snow than the long-term historic average for snowfall in December of 17 inches. The year before, December of 2023 only had 6 inches of snowfall for the month in town.
January 2025 wasn’t as bountiful, with only 10.2 inches of snowfall in town. That’s almost 9 inches shy of the average snowfall in town in January of 19 inches. The previous winter, in January of 2024, Jackson had 22 inches of snowfall, or 3 inches above the average for January.
Jackson’s total snowfall for December 2024 and January 2025 was 39 inches. The average total snowfall in town for these two months is 36 inches, so Jackson still ended up with above average snowfall for the first half of this winter.
This winter’s first half also beat the previous winter’s first half snowfall total by 11 inches. Total snowfall in town for December 2023 and January 2024 was 28 inches.
Town Temps
Temperatures in the Town of Jackson rode a thermal roller coaster in December and January. Historically, those two months have some of the biggest temperature swings of any months of the year in Jackson.
December of 2024 was relatively mild, with high temperatures running about 3 degrees above average and overnight low temperatures that were 7 degrees warmer than average. It would snow, then warm up, rain a little, then cool off. That process repeated itself a few times this past December.
Oddly, the warmest day this December came late in the month, on December 29th, 2024, the high was 43 degrees in town. The coldest temperature for the month was zero degrees, on three occasions, December 10th, 12th and 20th.
January 2025 was quite the opposite, with the average high temperature for the month more than 4 degrees colder than average and the average low temperature this January more than 6 degrees colder than the long-term monthly average.
The warmest day of the month was on January 3rd, 2025, which also had a high temperature of 43 degrees. The coldest day of the month was on January 20th, 2025, with a low of minus 26 degrees in Jackson. That came in the depths of an Arctic blast that we received from Canada, when it was also 20 below zero all the way up to the 10,000 foot elevation in the mountains.
The month of January 2025 racked up 20 days with morning lows that were zero degrees Fahrenheit or colder. For a total of 23 days in the two months of zero or colder.
A year ago, December of 2023 and January 2024 both had above normal temperatures in town, with a total of only 13 days with zero degrees Fahrenheit or colder.
The warmest temperature during the first half of winter last season was 49 degrees on December 5th, 2023. The coldest day was on January 16th, 2024, with a temperature of minus 28 degrees.
Mountain Snow
December of 2024 had 92 inches of snowfall recorded at the Rendezvous Bowl weather station around the 9,600-foot elevation at the Jackson Hole Mountain Resort. That’s above average and way better than December of 2023, which only had 55 inches. The long-term average snowfall at that site in December is 82 inches.
January 2025 also flip-flopped from the year before, with only 56 inches of snowfall at Rendezvous Bowl, which is well below January 2024’s total of 75 inches. Both of the last two January’s ended up short of the long-term average for snowfall in January at Rendezvous Bowl of 86 inches.
Total snowfall for the first half of this winter, 2024-25, at Rendezvous Bowl was 148 inches. That’s better than the previous December-January, 2023-24, which only had 130 inches of snowfall. Both however were still below the long-term average total snowfall for December and January combined of 168 inches.
You may recall what happened last year in the second half of winter, February and March were both way above average for snowfall, in town and in the mountains. Could we see a repeat performance this year?
Jim is the chief meteorologist at mountainweather.com and has forecast the weather in Jackson Hole for over 30 years