(This article first appeared in the Jackson Hole News & Guide, Nov. 23rd, 2016 issue.)
About a week or so ago, NOAA’s Climate Prediction Center announced that, “La Nina conditions were present and favored to persist through the winter 2016-17”. This caused local skiers and boarders to rejoice with primal screams of joy and dreams of a HUGE powder season. Why? Because they have been told over the years that: La Nina is good for snow and El Nino is not.
I hate to be the one to scrape the wax off your boards, but you need to slow down a minute and understand what exactly La Nina is, and what it MIGHT mean for snowfall around Jackson Hole in the winter. That is what I will attempt to bring to this week’s column
What is it?
La Nina & El Nino are conditions that occur in the Equatorial Pacific when there is a departure from “normal” Sea Surface Temperatures. We call it an El Nino when these temperatures are warmer than normal, and La Nina they are cooler than normal.
During an El Nino, there is a weakening pressure gradient between the eastern Pacific & western Pacific, and weaker easterly trade winds develop, allowing warmer surface water to surge eastward, replacing normal cooler water off the coast of South America. This leaves a belt of warm water along the Equator in the Pacific.
La Nina conditions occur when those easterly trade winds are stronger, causing cooler water in the eastern Pacific, near the coast of South America, to spread westward. That leaves a belt of cool water along the Equator.
How much warmer or cooler those water temperatures are, determines how strong or weak the El Nino or La Nina is. Since temperature and pressure are directly related, El Nino or La Nina will have an affect on the pressure patterns (weather patterns) and the jet stream (storm track) across the northern Pacific Ocean during the winter months.
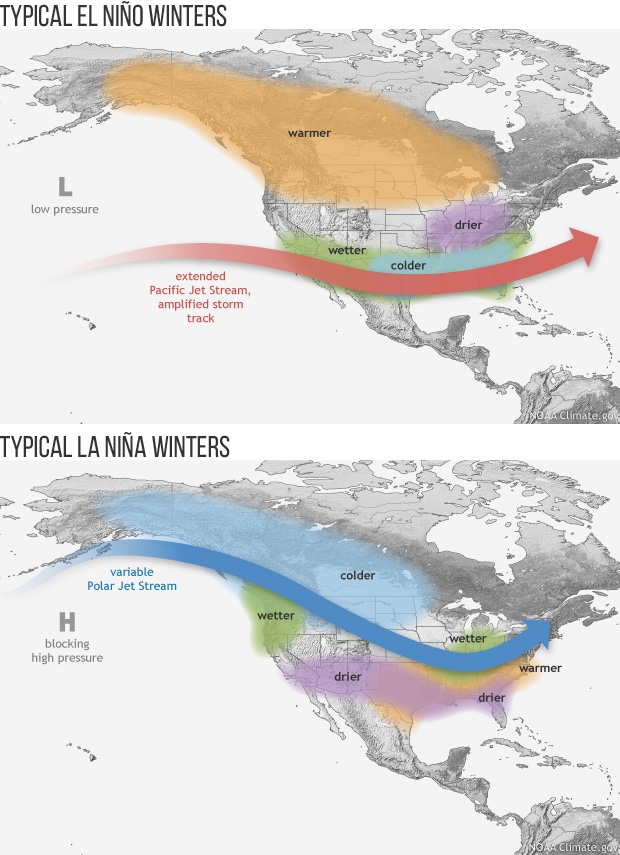
Typically, during El Nino winters, the Southwestern U.S is cooler and snowier, while the Northwestern U.S. is warmer with less snowfall.
Typically, during La Nina winters, the Northwestern U.S. is cooler with above normal snowfall, while the Southwestern U.S is warm and dry.
How Big is it?
Calling for a “La Nina Winter” is not a slam-dunk that we will have above average snowfall. At this point, we have what is considered a weak La Nina, and the Climate Prediction Center is only giving it a 55-percent probability of persisting during the December, January and February time-frame. That probability drops to a 43-percent for the 3-month period, January though March.
During our most recent strong La Nina winters (2010-11 and 2007-08), we had way above normal snowfall. These were banner winters for powder. However, during the latest two weaker La Nina’s (2000-01 and 2011-12) Jackson Hole experienced below normal snowfall.
The same comparisons could be made for El Nino Winters. Remember last year? The Super El Nino, the Godzilla of all El Ninos, it was called. We were supposed to be drier than normal. We were not, snowfall in town was right at average, and the mountains were just above average.
The weather is never as cut-and-dried or as simple as you might believe. It’s complicated, has lots of moving parts, and La Nina is just one of those parts. A small shift in the weather pattern out in the Pacific, at any given time during the winter, can have a major effect on where storms track across the Western United States. Thus, the variability we see from one El Nino or La Nina year, to another.
I like to say, “The reality of the weather is not always as described in the forecast”.
All that said, I will still guarantee you, that every time we get a good snowstorm this winter, people will say, “How about that La Nina, pretty good, huh?” And, every time we go through a week without any snow, they will ask, “What happened to that La Nina? Where did it go?”
Jim is the chief meteorologist at mountainweather.com and has been forecasting the weather in Jackson Hole and the Teton Mountains for 25 years.