All posts by Jim Woodmencey
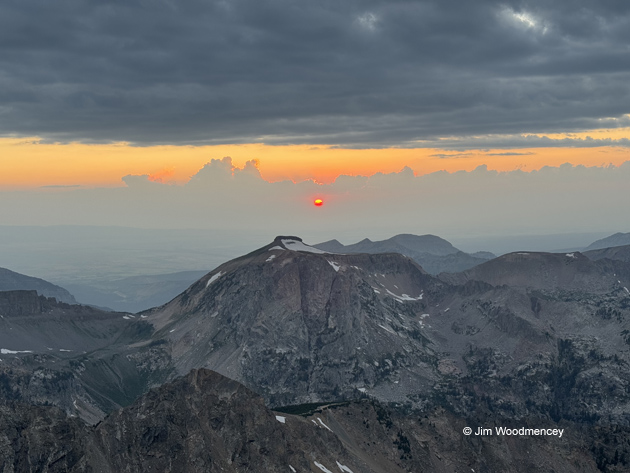
Sunset and Smoke
Teton park nights are warmer, and we caused it
A recent article in the Jackson Hole News & Guide entitled, “In Teton park, nights are becoming warmer”, naturally caught my meteorological eye. The article was generated from a recent climate assessment done for Grand Teton National Park. That report analyzed the historic temperature data from the Moran weather station, shown in the graph provided here from Grand Teton National Park’s website.
Read the JH News & Guide article here. See the park report here.
As the article pointed out, “Between 1911 and 2022, daytime highs didn’t demonstrate a strong trend. But nighttime lows have increased between 3 and 4 degrees over the same 111-year period”.
I was curious about that, so I examined the data a little more closely. Some might appreciate the additional analysis; others may curse me!
Let me also preface this by saying I am not rejecting that there have been periods of warming in recent decades, but keep in mind, any study of weather or climate is only as good as the data that goes into it.
A Look at the Graphs
The first thing that is obvious from the upper graph is that the mid-1920’s to mid-1930’s had the warmest daytime high temperatures, or average daily max temps. That was during the Dust Bowl years. Then it cooled until the early-1950’s. Following that, max temps remained relatively steady until the mid-1980’s when average daytime high temperatures rose a little through the late 1990’s.
(Green lines are the 5-year running average. Click graph to enlarge.)
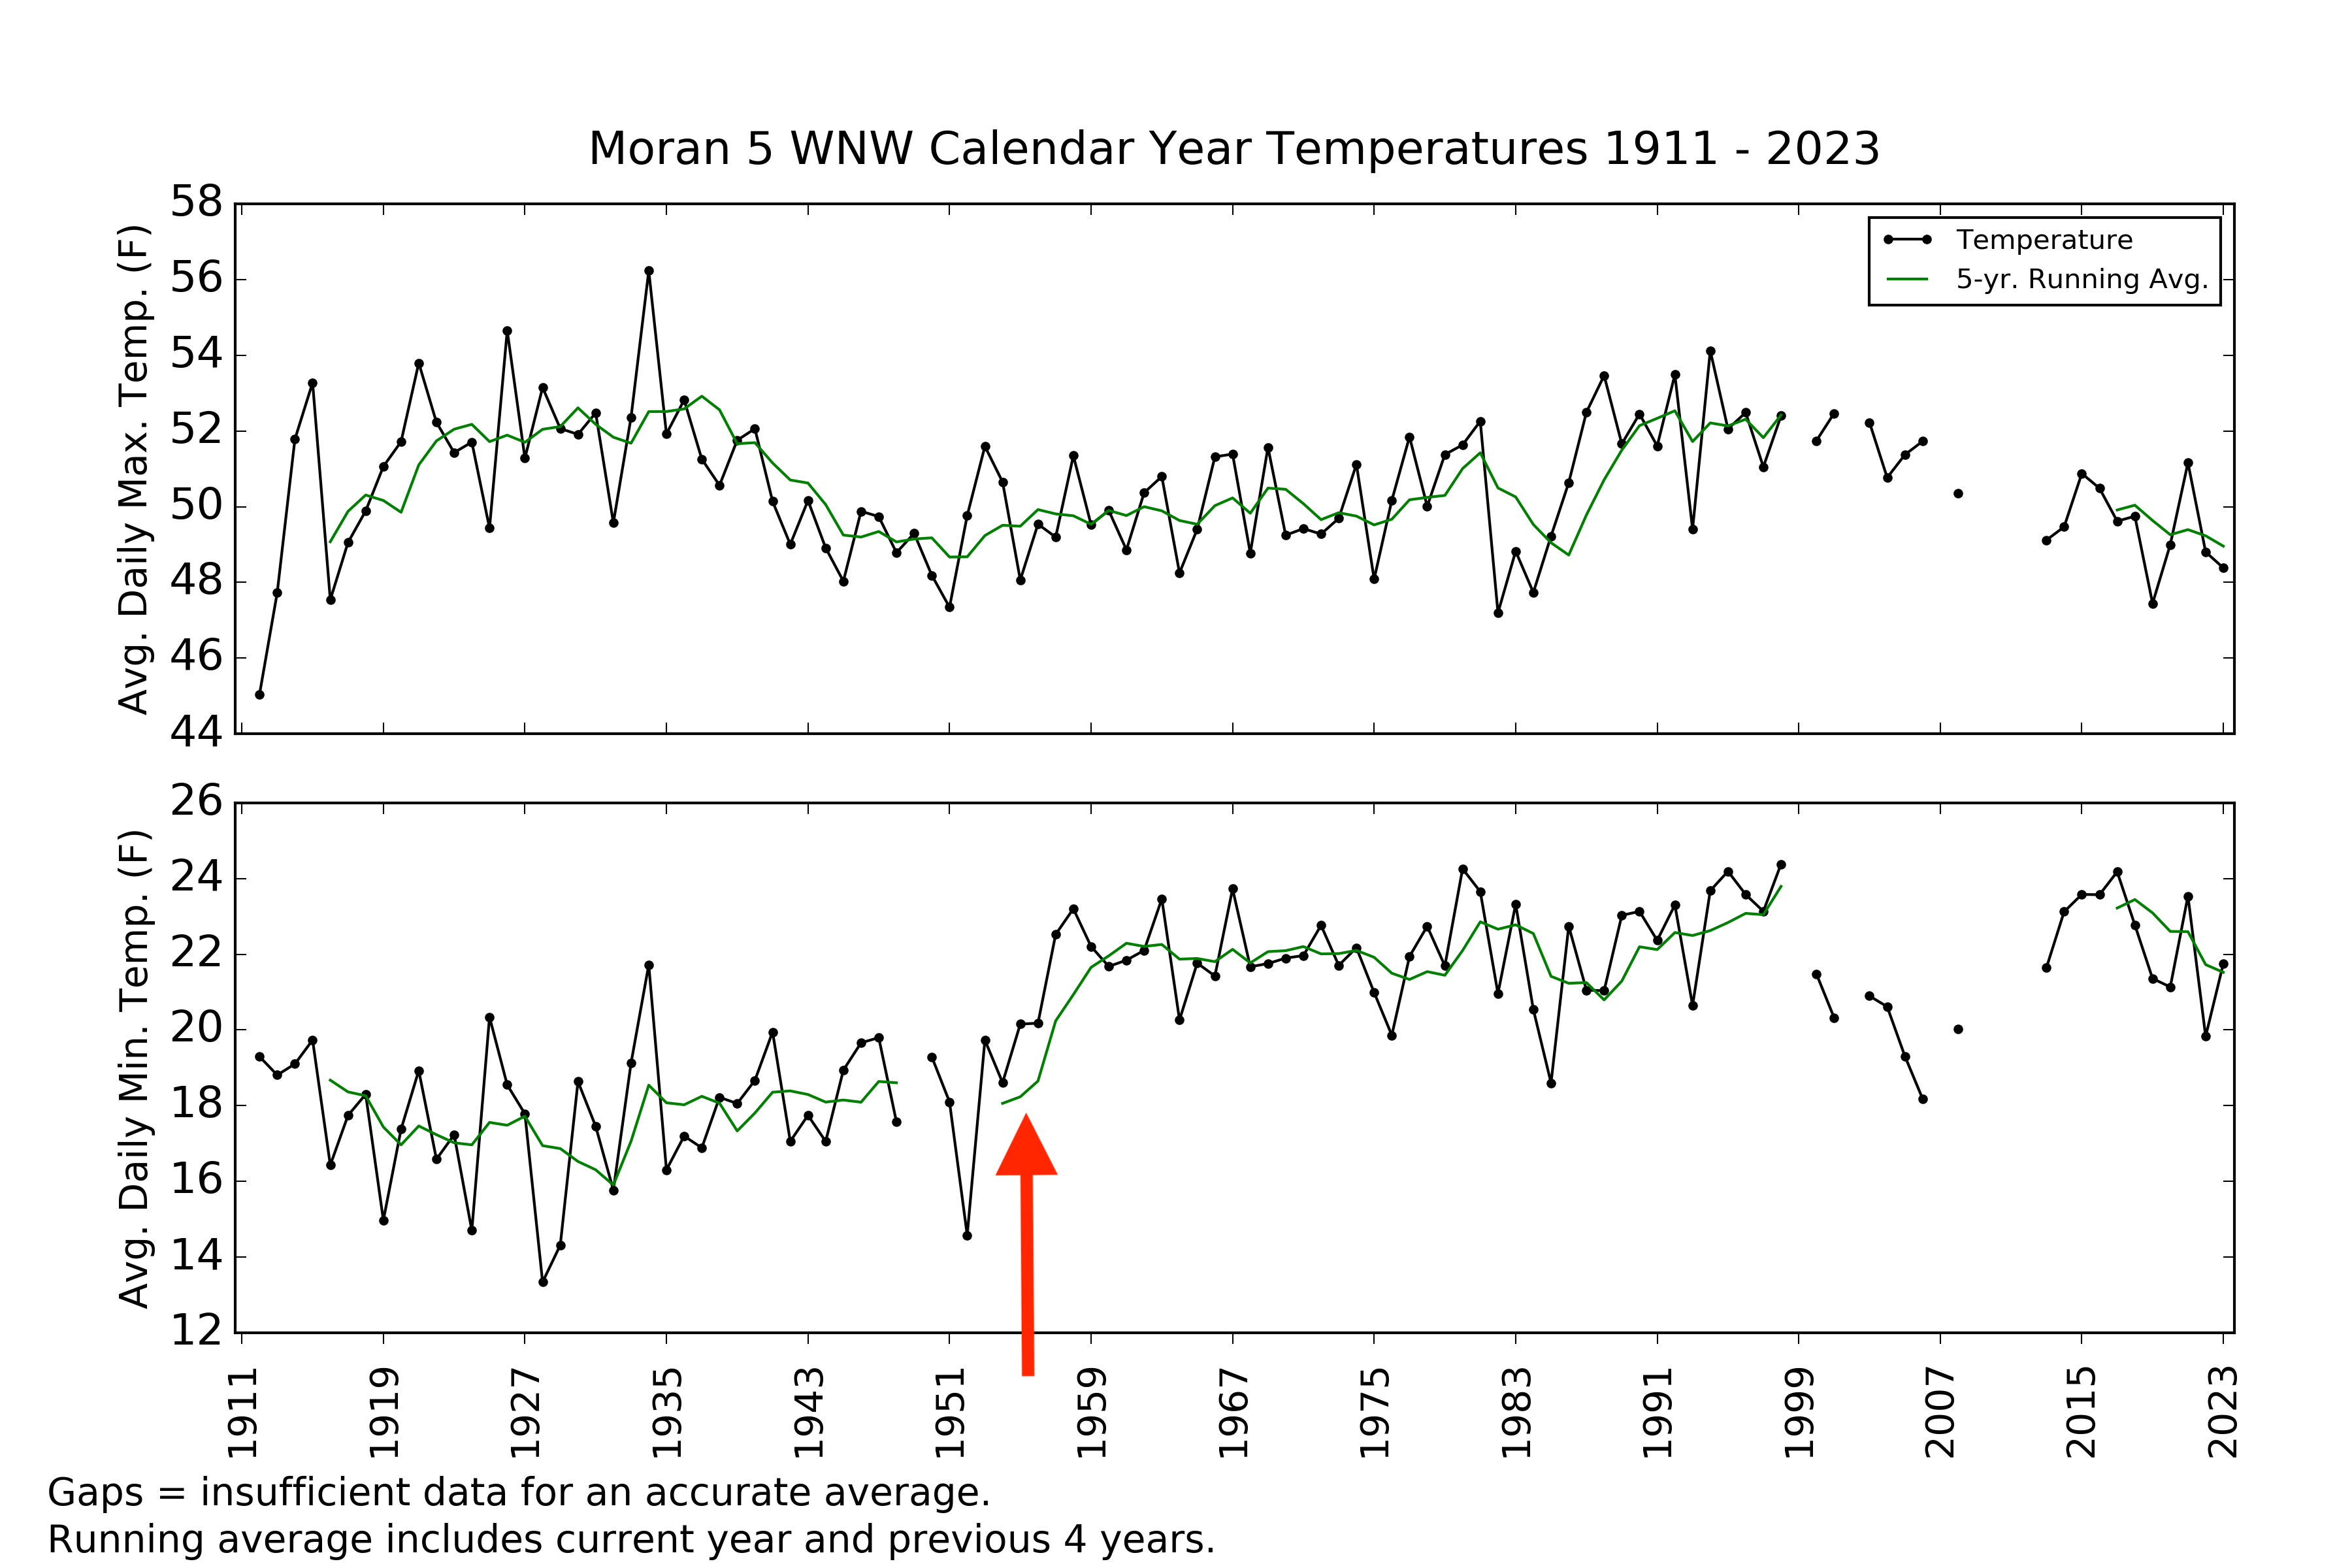
At the same time, the average overnight low temperatures, the average daily min temps on the lower graph, were relatively steady from 1912 through the early 1950’s. Then in the mid-1950’s there was a significant jump in the average minimum temperatures, of around 4 degrees Fahrenheit. After that jump, the average overnight low temperatures remained elevated and relatively steady through the late 1990’s.
There is plenty of missing data from 1999 to about 2012, I’ll explain why shortly. The last thing to note is that during the latest 10-year period, from about 2013 to 2023, the graphs show a slight downward trend of both the average maximum and minimum temperatures. There is a reason for that, which I will also explain.
The climate report made a big deal out of the 3 to 4 degrees rise in overnight low temperatures over the last 111 years, relating it to earlier season snow-melt in the mountains in recent years, and a host of other issues.
So, what caused that rapid rise in minimum temperatures in the mid-1950’s?
Could it be an Urban Heat Island effect, like what happens in big cities with ever more expansive areas of pavement, concrete, buildings, etc. surrounding the weather station, acting as a giant heat sink? No, probably not in the park, where the landscape hasn’t changed all that much in the last 100 years. Was it an increase in tourism and more cars spewing exhaust? I don’t think so. But I can tell you, it was human caused!
Data and Metadata
When doing a climate assessment of any weather station it is not only important to scrutinize the data, but also the metadata. Metadata is the station’s record of its location, elevation, topography, the surrounding vegetation, and any nearby buildings. It also indicates each time the station was relocated and when the instrumentation changed. Metadata helps determine the validity of the data.
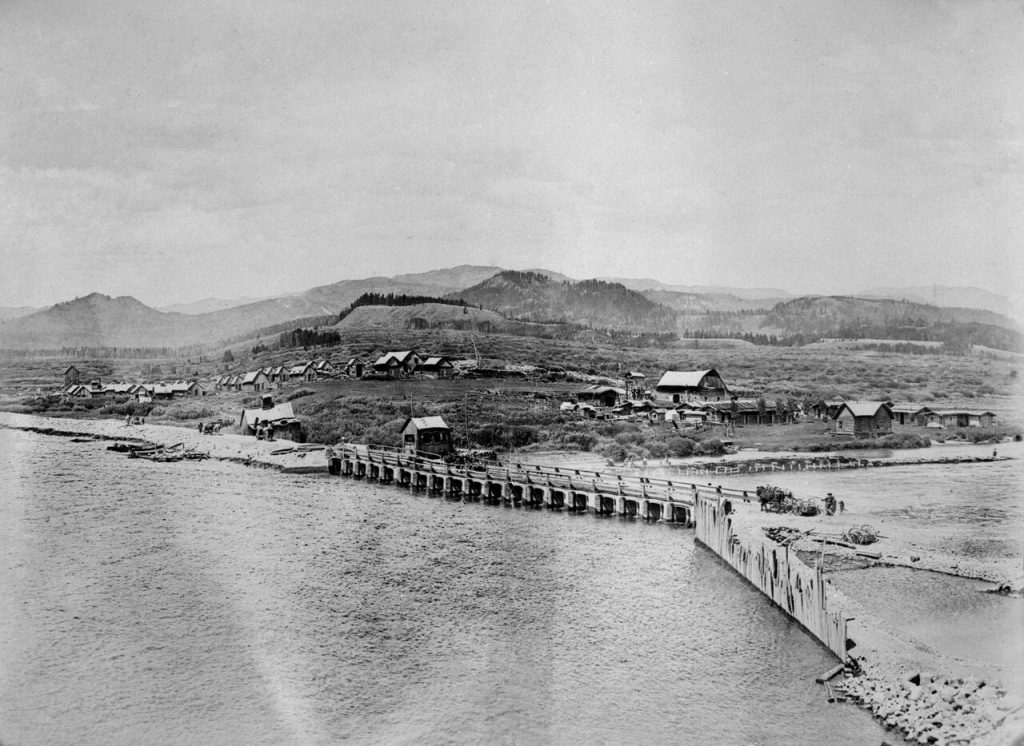
The Moran weather station, which was used in this report, is known as “Moran 5WNW”. It is located near the Jackson Lake Dam, 5 miles west-northwest of Moran Junction. This station does have the longest continuous record of temperatures in Grand Teton National Park. However, there are some problems with the data from Moran.
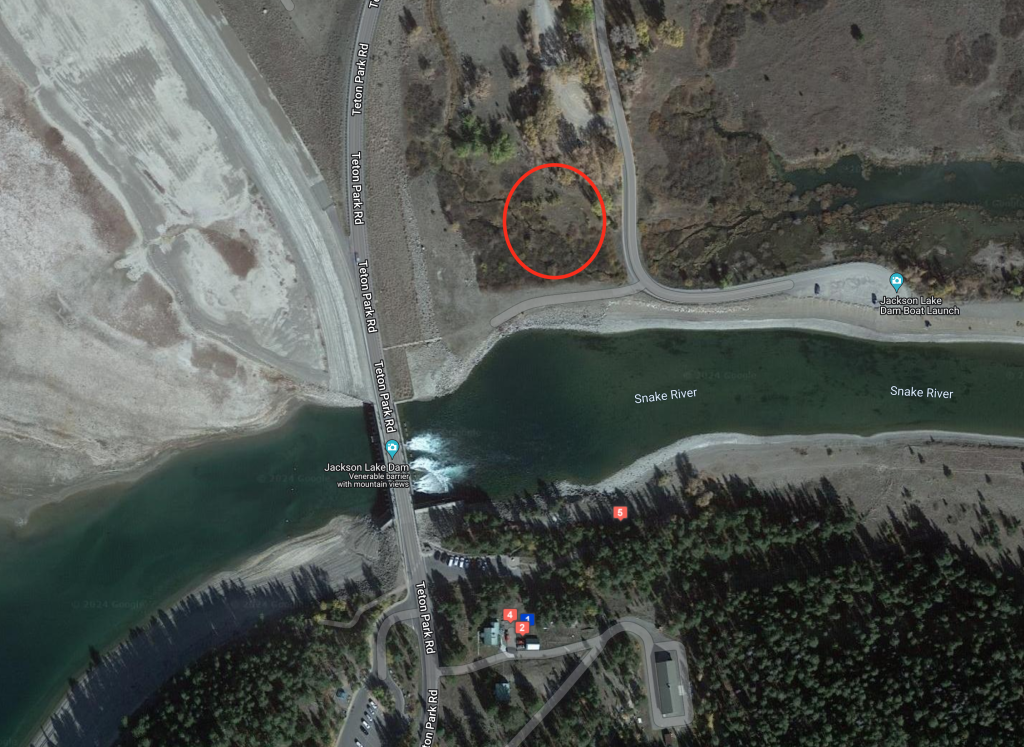
The first problem with this weather station’s data is that the instruments were moved several times over the years. Originally, the official weather station was located at the old Moran townsite, on the north side of the river, in a marshy area of grass and willows. It sat just northeast of where the dam was being constructed. In 1954 it was moved approximately 0.3 miles south of its original location, to the south side of the river, and up on the river’s bench, in sage and trees.
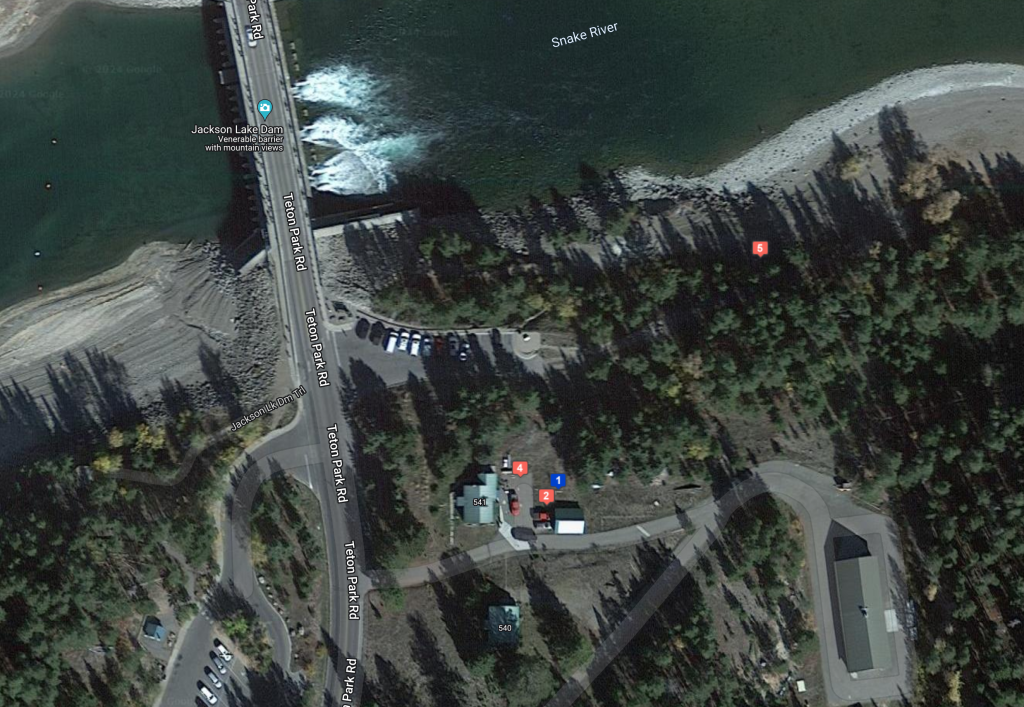
The location of the weather instruments shifted around a few more times between 1954 and into the 2000’s, coming to rest more permanently next to the Bureau of Reclamation buildings, just south of the dam, on the second bench above the river. The official thermometer now sits over a mix of low grass and dirt, surrounded by mature conifer trees.
According to the NWS’s Compatibility Determination for Site Moves, “Station moves where the new equipment location is within 5 miles of the original site and the difference in elevation is 100 feet or less are also assumed to be incompatible unless they pass a data compatibility evaluation. While most re-locations are expected to exhibit data incompatibility, there may be cases when the data record from the new location may be a faithful continuation of the climate record from the old location. However, the compatibility evaluation will be conducted for all relocations of less than 5 miles and/or 100 feet unless the move is deemed incompatible by the NWSREP.”
If a station moves more than 5 miles or more/less than 100 feet in elevation, then the station must be renamed. Moran 5WNW moved 0.3 miles and about 65 feet higher in elevation, according to the metadata. I am not sure if a compatibility test was ever done for the Moran site in the mid-1950’s. Although, in terrain like we have here in Jackson Hole, the micro-climate changes quite a bit with changes in the micro-terrain.
The Big Change
The relocation on November 1st, 1954, was significant, as that slight change in elevation to the bench on the south side of the river, coincides with the biggest rise in average daily minimum temperatures on the graph.
Keeping the thermometers up out of the marshy flat would get them up above the lowest level temperature inversions, which are common all year, especially along the river. That would lead to the thermometers registering warmer overnight lows as compared to pre-1954.
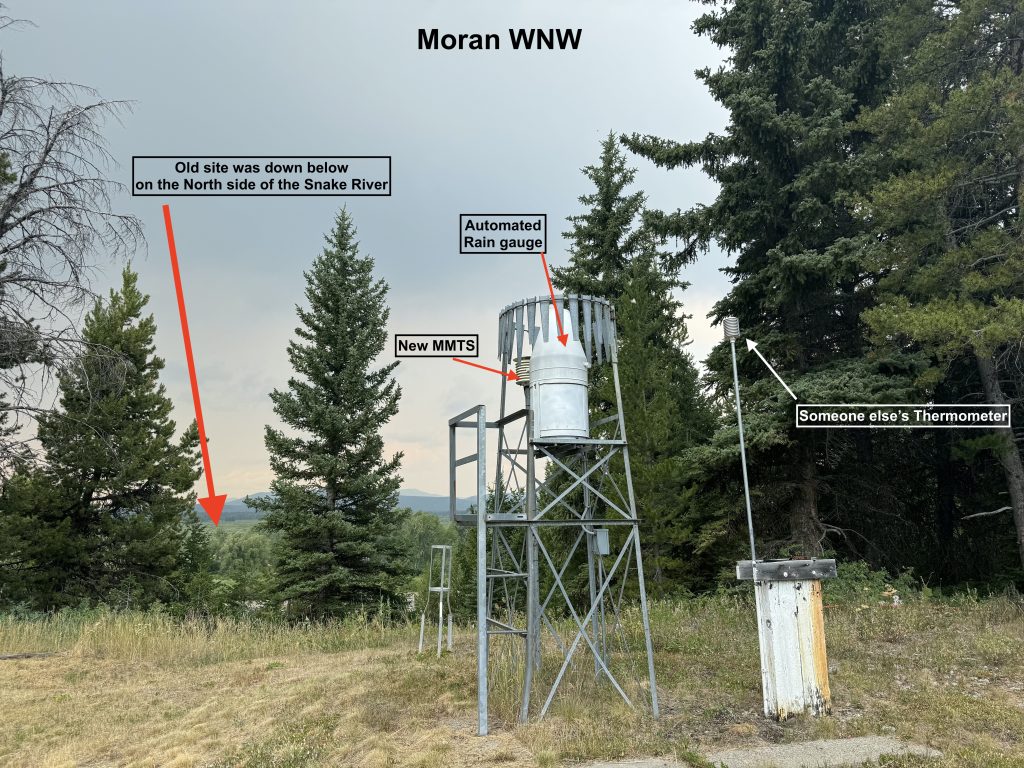
In 1999 the instrumentation changed from a Liquid-in-Glass thermometer system to an electronic one, an MMTS system. According to the person in charge of monitoring these stations at the NWS in Riverton, WY, the reason Moran has so much missing data from 1999 to about 2012 was because of data-logging issues when they first changed the thermometer over to an electronic system.
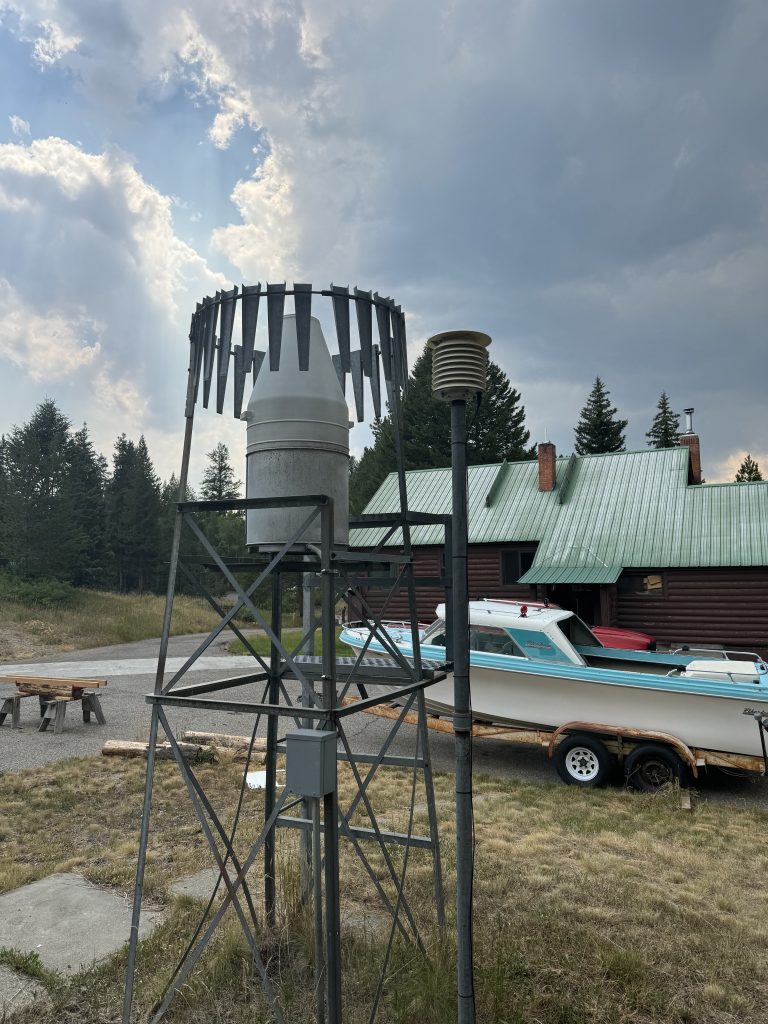
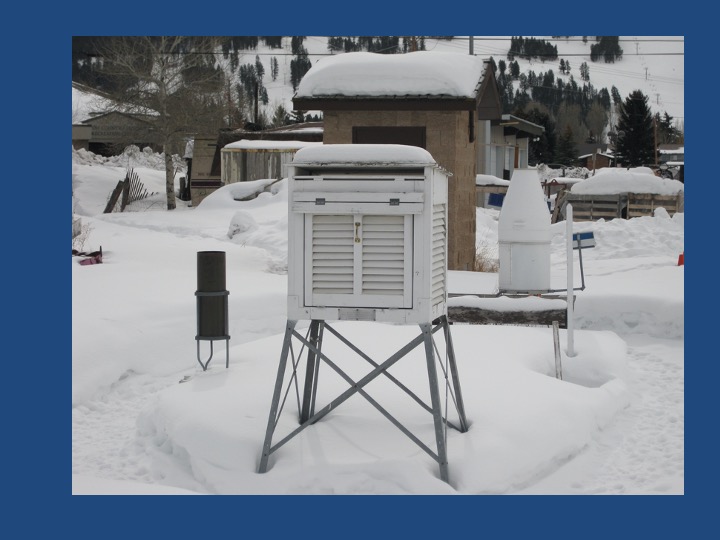
I would also note, that upon inspection of the Moran weather station the MMTS, the beehive housing is of the correct standard size specified by the NWS cooperative weather station standards. However, the thermometer housing is currently mounted over 8 feet above ground level. The NWS standard for official thermometers is that they are to be between 4 and 6 feet above the ground. The reason for mounting it higher at Moran is to accommodate for snow depth on the ground in the winter.

What difference would it make mounting a thermometer higher than standard above the ground? It affects the temperature readings, especially during the summer months when the ground is free of snow. In general, a thermometer that far above bare ground would yield slightly cooler daytime high temperature readings and slightly warmer overnight low temperature readings.
So, yes, it would be correct to say that the changes in temperature in the park were human caused. In this case, because humans moved the weather station.
Read more about thermometers and temperatures here.
Other Notes on the Study
In the newspaper article, the author, through the climate change report, attempted to tie the temperatures at Moran, on the valley floor in Grand Teton National Park, to earlier season snow-melt in the Teton mountains, claiming that, “Snow is disappearing earlier and earlier. Higher than usual nighttime temperatures, which allow snow to melt around the clock , quickly clear the mountains of frozen material in the spring.”
The article went on to state, “This July at the Moran weather station, the lowest minimum temperature – a proxy for nighttime temps – was 34 degrees Fahrenheit, 2 degrees above the average for July from 100 years of data… “.
There was no mention that in the last 100 years there have been 25 other years when the lowest minimum temperature in July at Moran was 34 degrees or warmer, including in 1925 & 1957, along with a string of years in the 1960’s, 1980’s, 1990’s and early 2000’s. July 2021 did have the warmest of these lowest minimum temperatures at 41 degrees.
There was also one gross error in the article , which stated, “Record-high minimums for June, July, and August were all set in the last 10 years”. Moran’s data shows that the record high minimum temperature recorded in June was 58 degrees in 1927.
The warmest minimum temperature recorded in July was 59 degrees in 1960.
The warmest minimum temperature recorded in August was 59 degrees in 1991.
I think what the author meant to point out was the lowest minimum temperature in each of those months, which did occur within the last 10 years:
In June 2015 = 36 F
In July 2021 = 41 F
in August 2022 = 37 F
I suspect those records are directly related to hoisting the Moran thermometer 8 feet above the ground.
I’d also add that using July minimum temperatures as a gauge for melting snow in the mountains was rather interesting, since by July most of the snow has already melted in the mountains. May and June are the peak snow-melt months in the mountains, yet there was no mention by the author that both May and June of 2024 happened to have lowest minimum temperatures that were one degree cooler than average.
There are times when overnight low temperatures in the valley will be cooler than temperatures at say 10,000 feet, and times when overnight temperatures in the valley will be warmer than temperatures in the mountains.
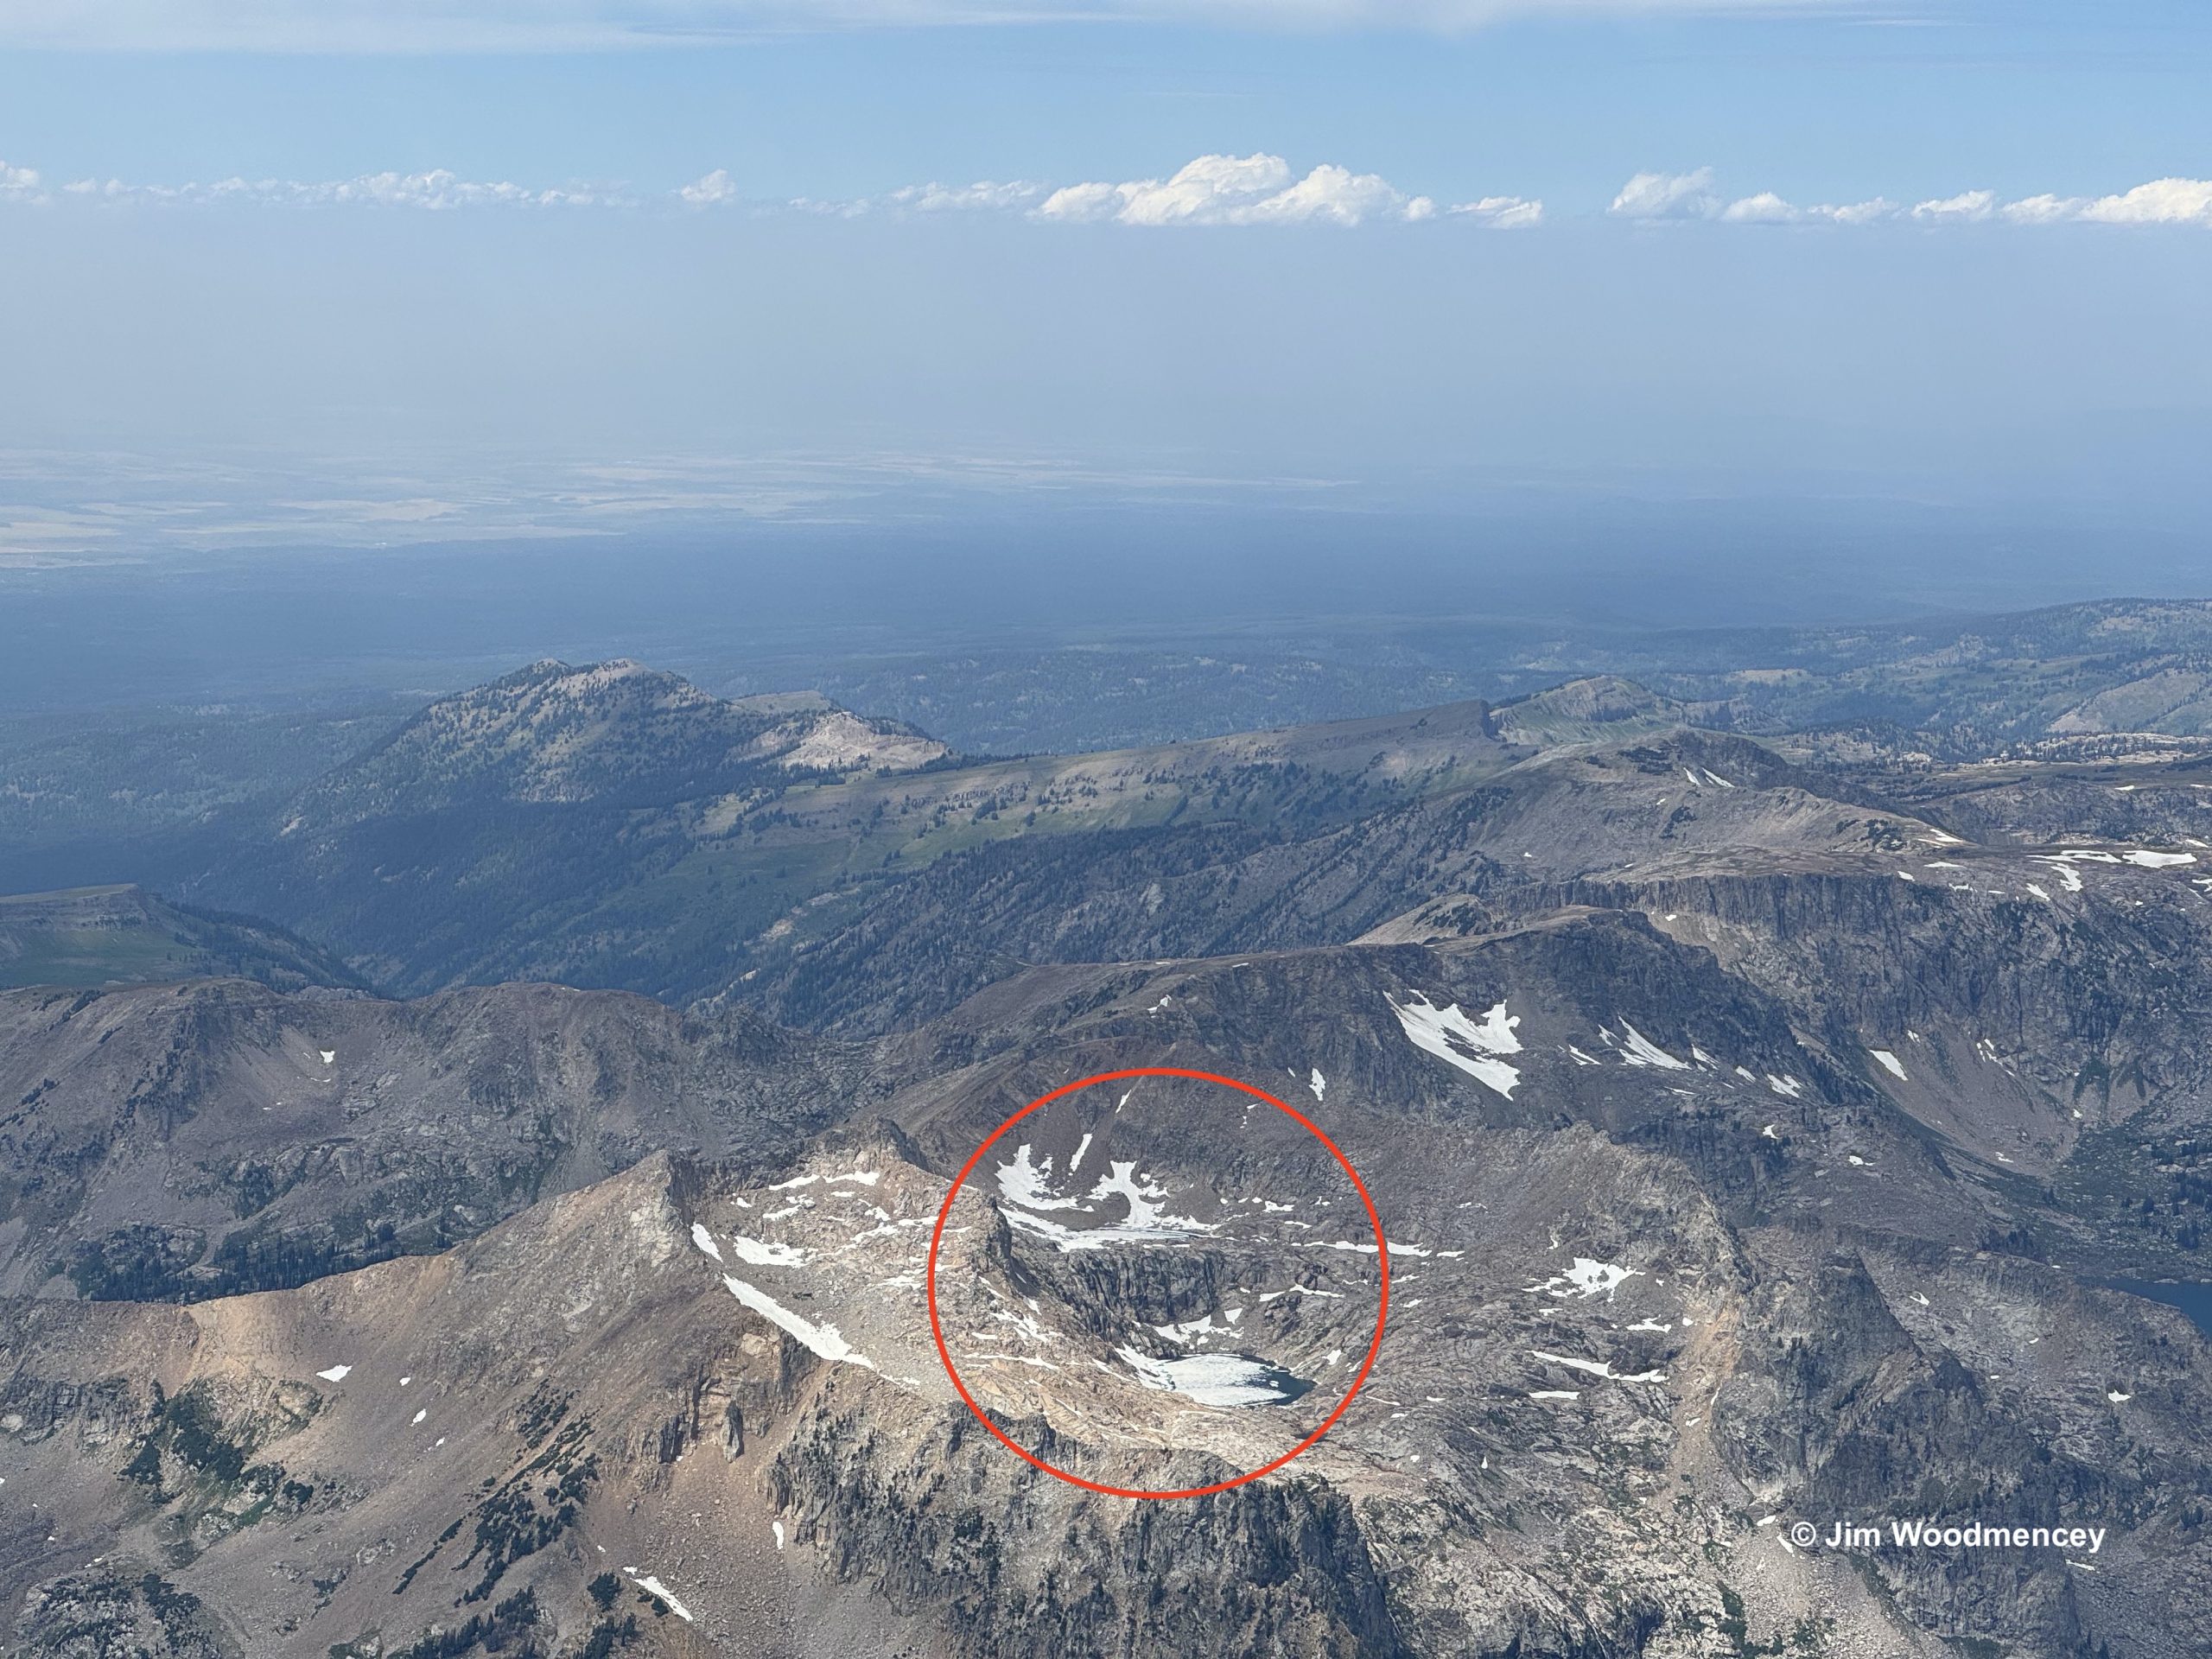
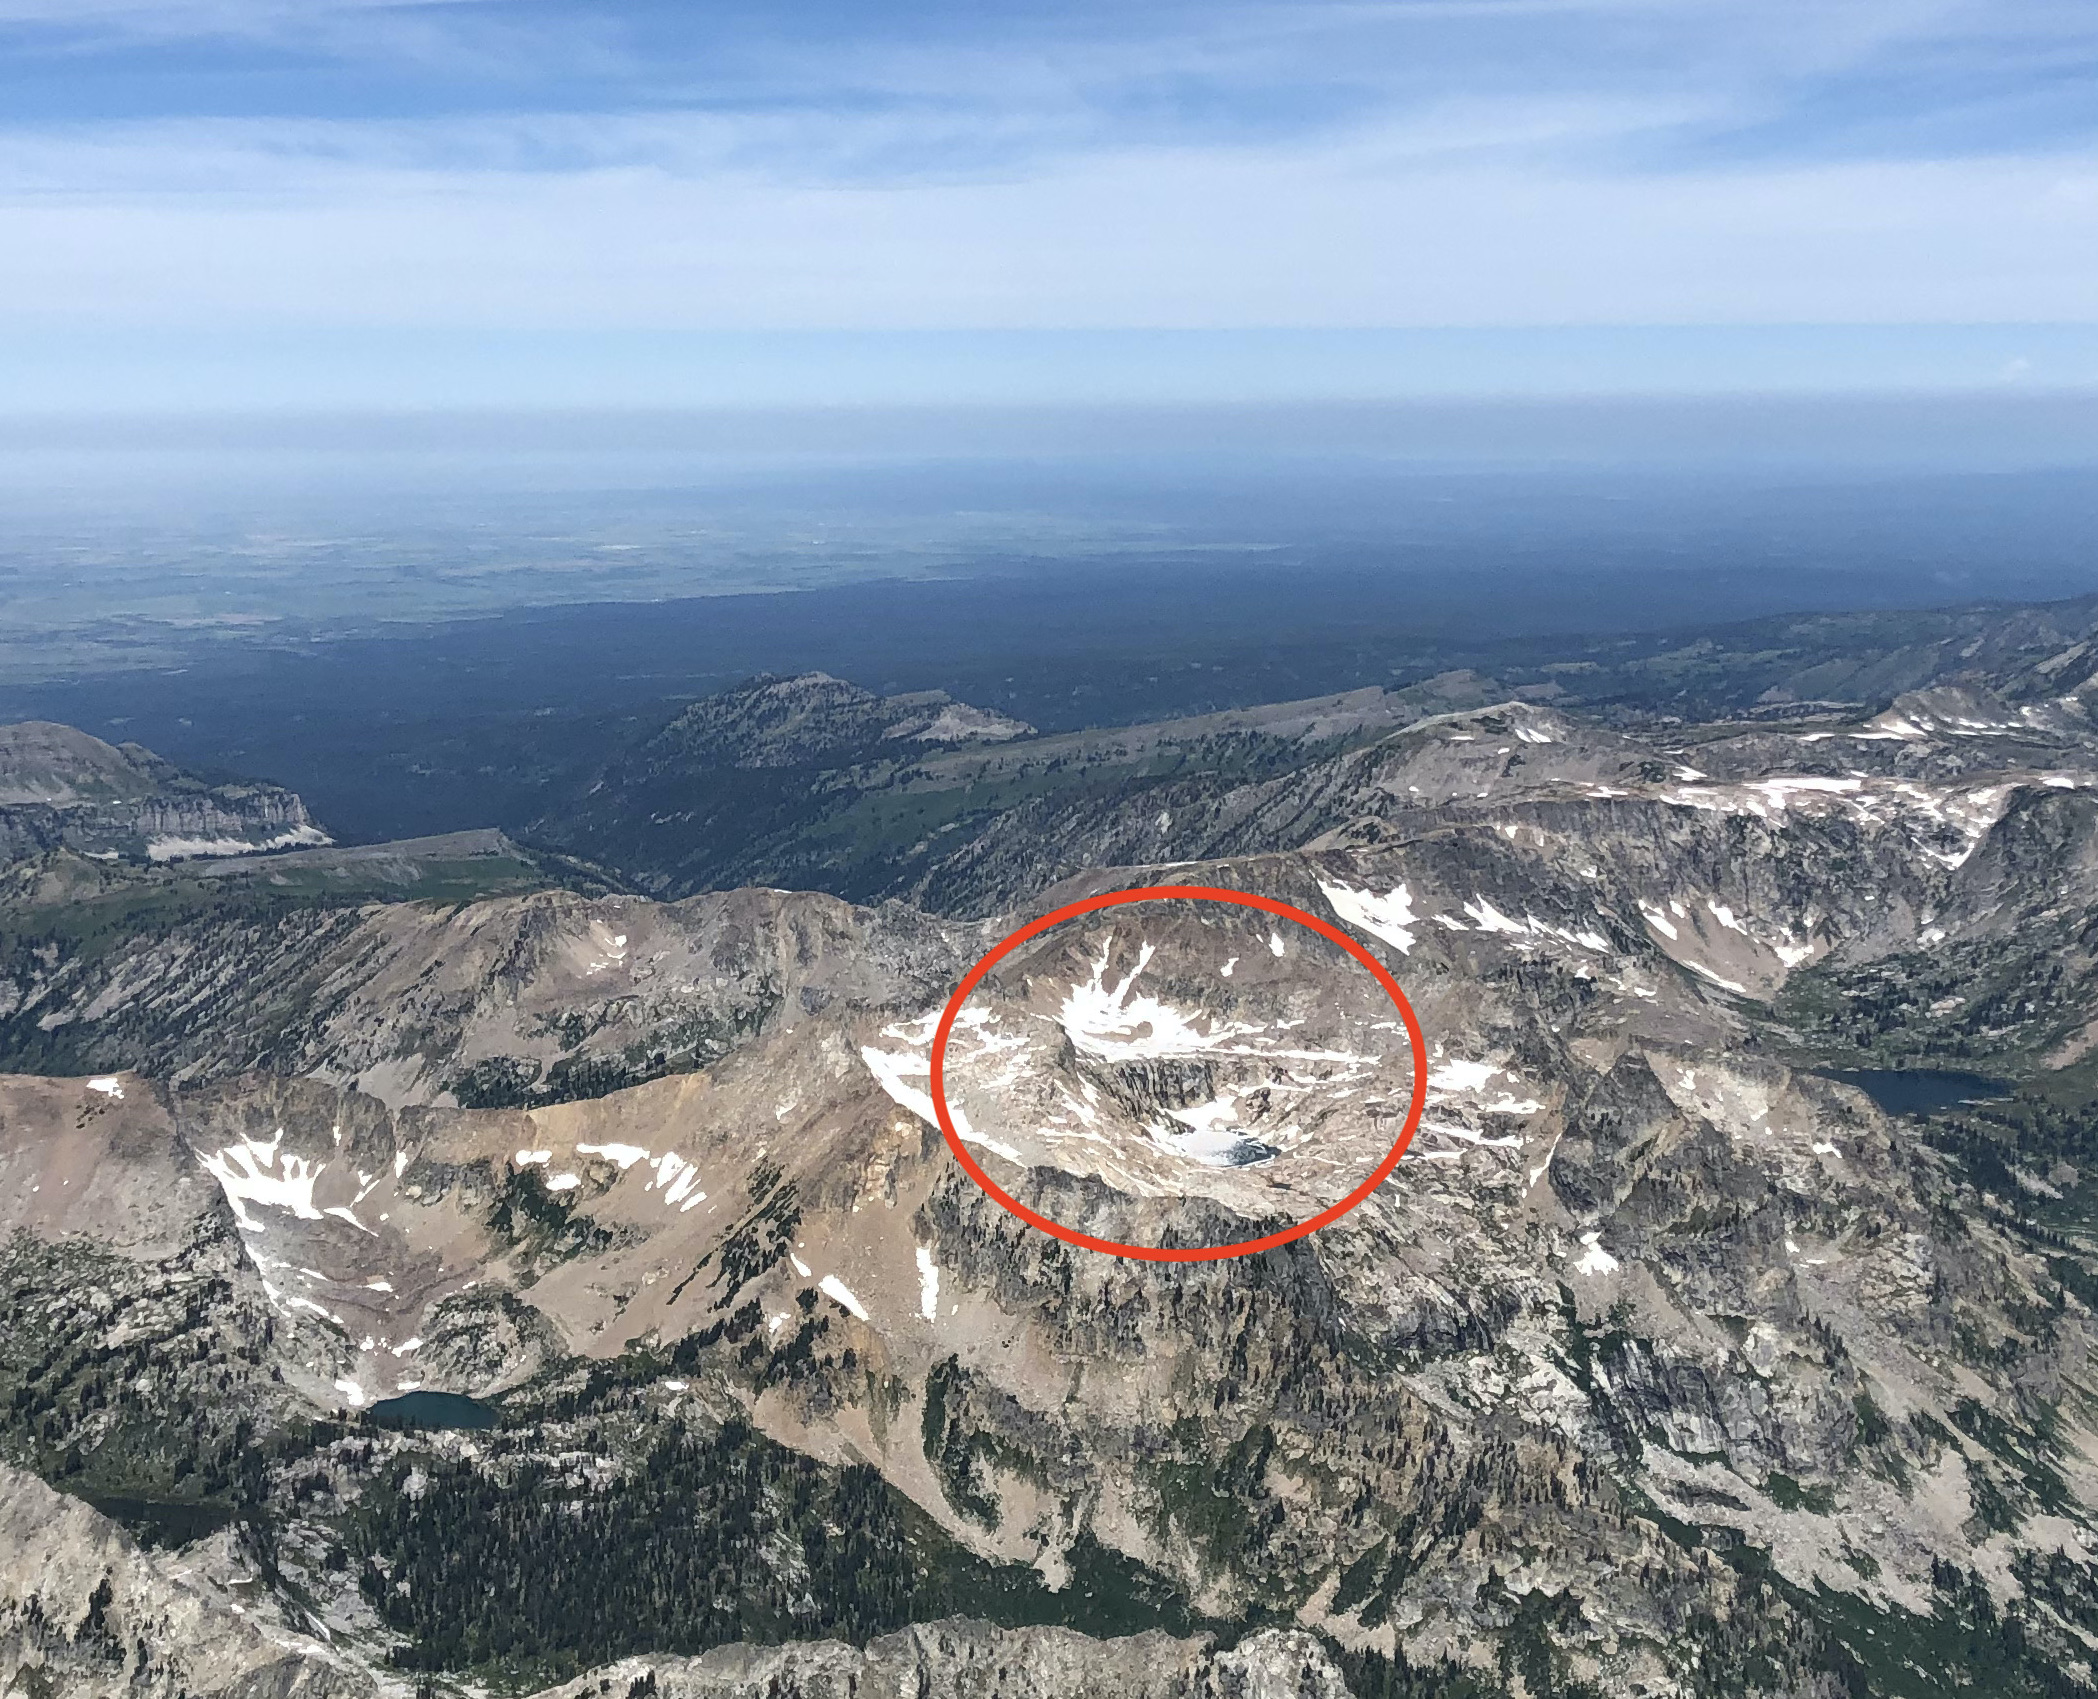
Some conflicting evidence of recent melting is shown below in these photos taken from the summit of the Grand Teton. The photos show Alpha & Omega lakes still mostly frozen in early August. The first one was taken August 5th, 2024. The second one was taken a year ago, on August 1st, 2023. Which leads me to think that in the last two years these lakes have not completed melted out.
Are these observations evidence that we are perhaps entering the next Ice Age? Probably not.
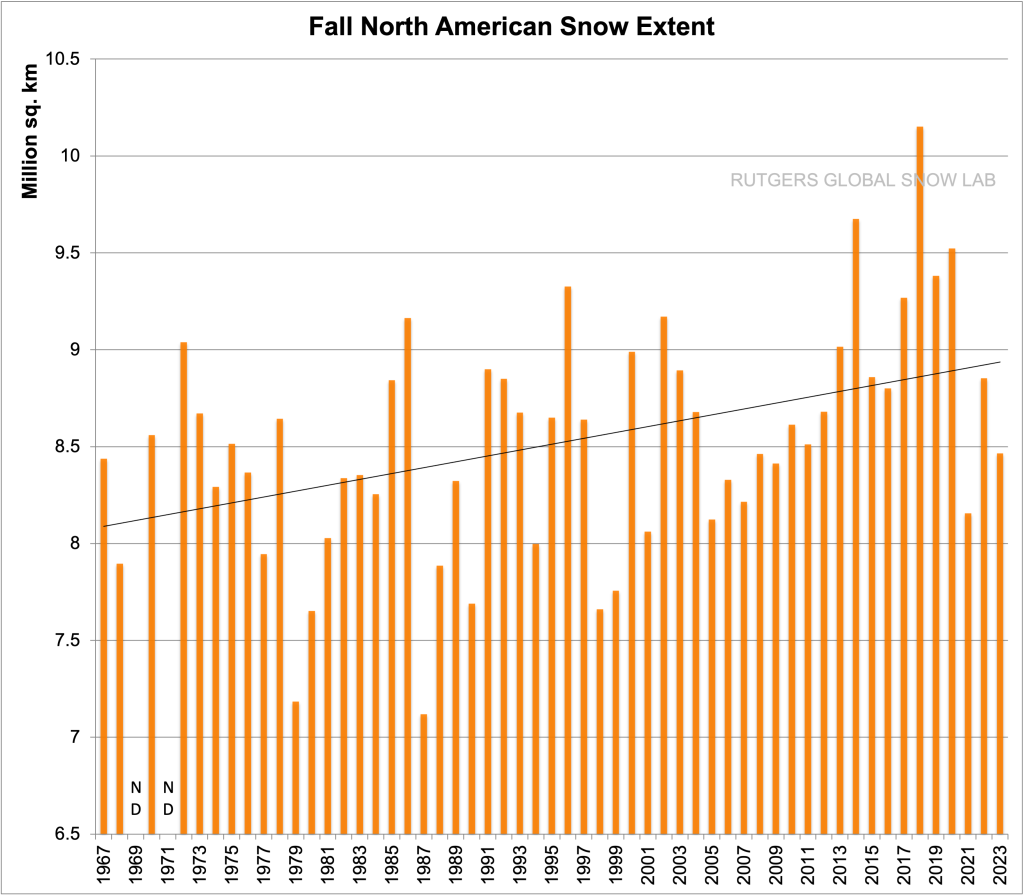
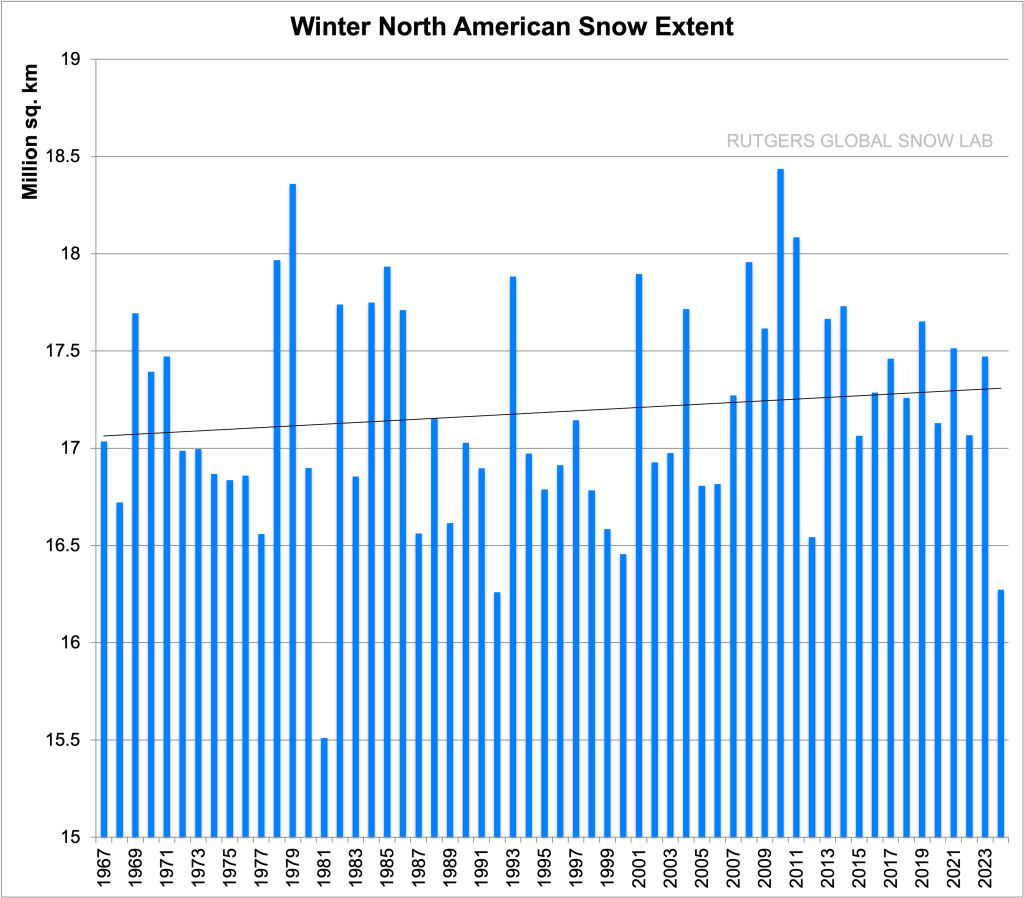
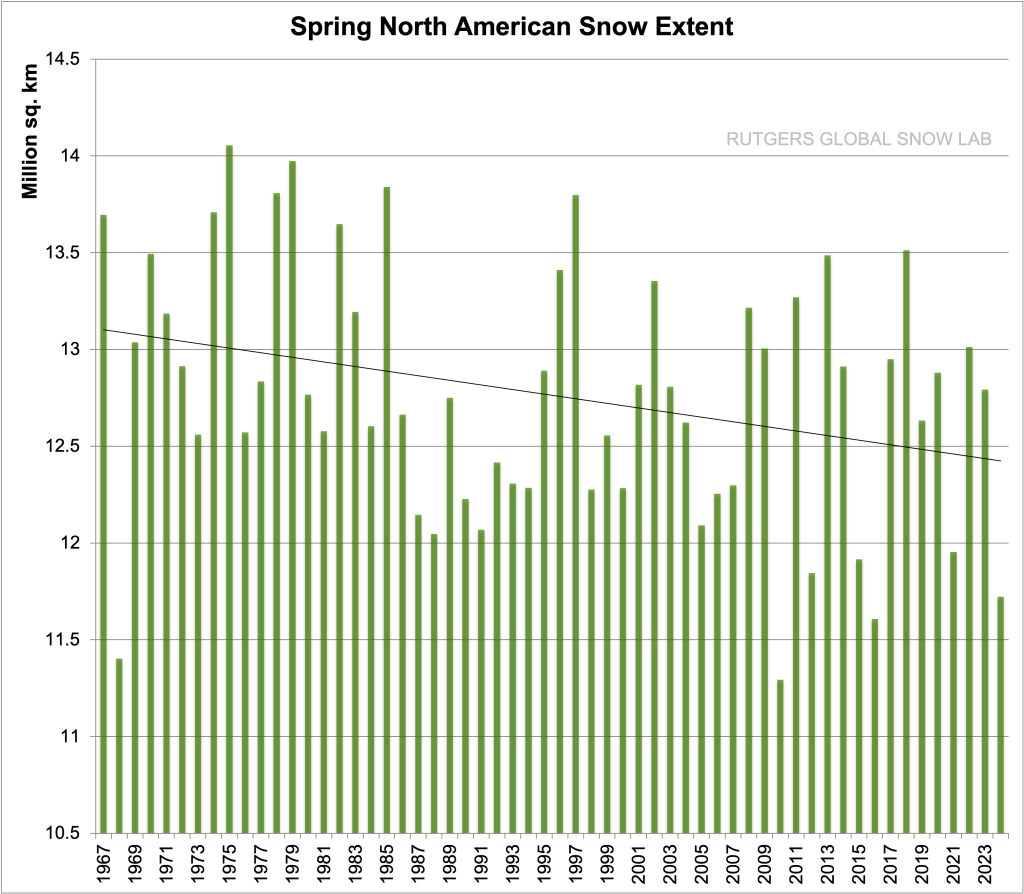
At the same time, I do not disagree with the organic observations that the snow-cover may be receding earlier in the spring, other data shows that. That same data also shows that snow-cover extent across all of North America is coming earlier in the fall and increasing , and has also been increasing slightly in the winter. This analysis is according to the Rutgers University Global Snow Lab.
Their graphs are shown below.
The Computer Model Predictions
The other graph that caught my attention from the park’s report was the one showing annual average mean temperatures. The data plotted on this graph is not actually from the Moran weather station. The temperature data shown on this graph in the black line is computer generated, for a point in the middle of the park near Leigh Lake and only plots data from 1979 to 2020. The blue and red lines are what the computer models are projecting temperatures to be into the future, under two different scenarios.
Below is the graph from the report, and below that is a graph of the actual data of the average annual temperatures for Moran for 1912-2023.
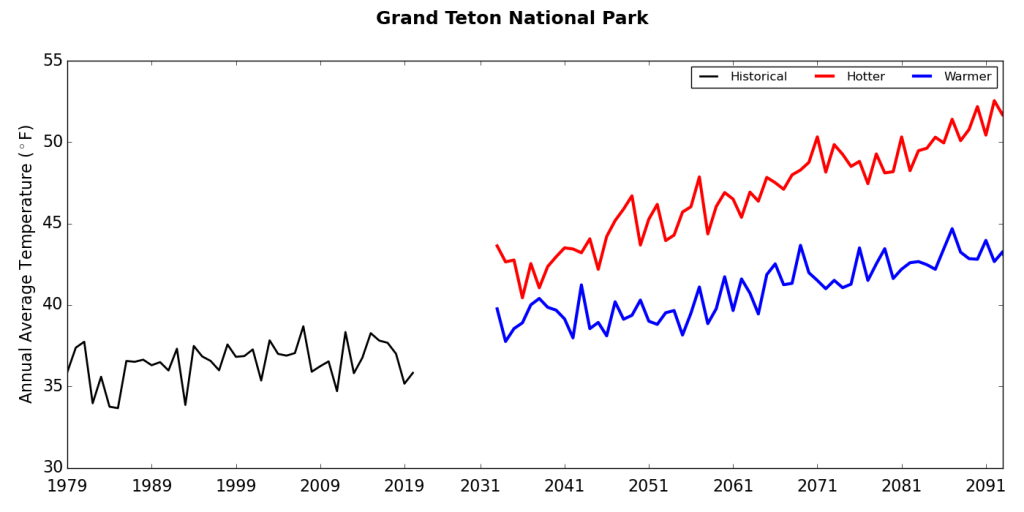
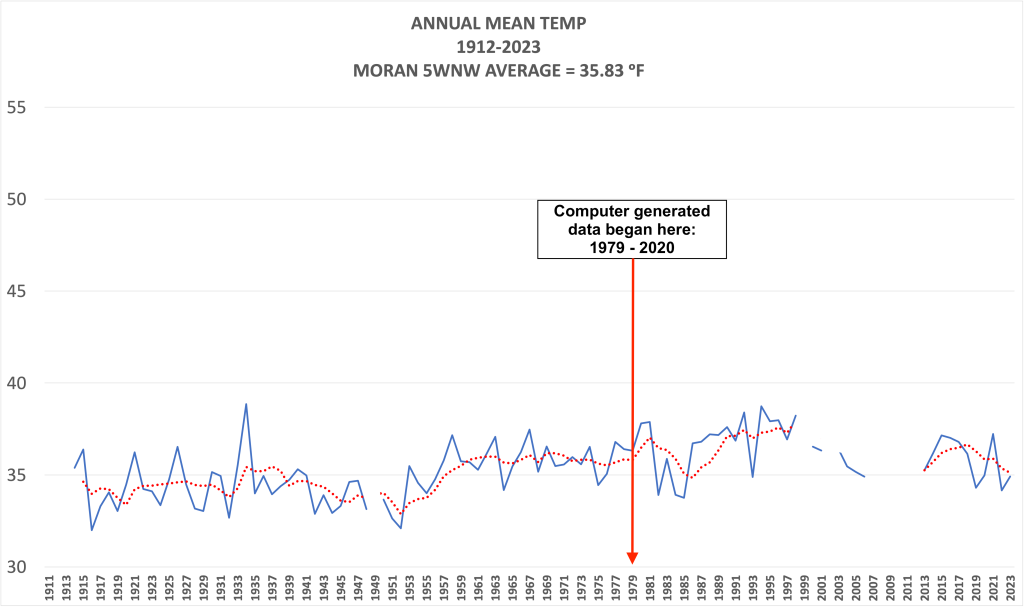
The computer-generated version shows that average annual mean temperatures remained relatively flat for the last 30 years, from 1979 to 2020. Actual data from Moran shows a little more up and down.
Regardless, it makes it difficult to fathom how computer models can project such a precipitous rise in annual average temperatures, 6 to 14 degree increase over the next 10 to 70 years, when the previous 30 years of the computer generated temperatures (as well as the actual temperature data from Moran) have shown no significant increases whatsoever.
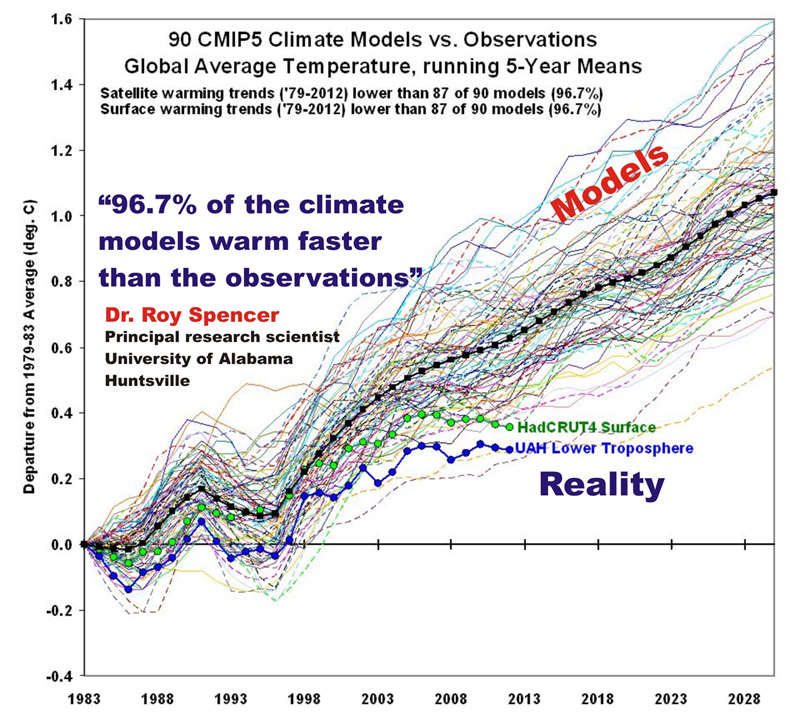
Model Reality Check
When you look at how the models have performed globally over the past 30 years, nearly all of them over-forecast surface temperatures. An example is shown below comparing model predictions to actual surface temperatures and temperature data from satellite observations, which began in 1979, of the lower atmosphere (the troposphere). The black line is the mean of all the models, green is actual surface observations, blue is satellite data. Baseline is relative to the first 5-year period 1979-1983. Chart shows the departure from that average through time, in degrees Celsius.
Final Thoughts
As a meteorologist, I have dealt with weather forecasts and computer models for over 40 years. For both short-range and long-range predictions. Forecasts and models are just guidance, they are not gospel.
Good or bad, day to day or over the long-haul, there are times when the forecast nails it, and there are times when it grossly misses what really happens, even for the next 24-hours! Models have become better and much more sophisticated over the years, but the science of weather is just not all that exact. There are literally too many variables to consider to make 100% accurate predictions, in the short term or the long term.
My intention is not to dismiss the Park’s climate report, but rather to demonstrate an application of the “Scientific Method”. When a theory is put forth based on data, and assumptions are made based on that data, then it becomes part of the process to question the data and examine its validity.
I’m not sure if the scientific method is even taught in schools anymore. My sense is we are just being told what to believe and never to question it.
As Albert Einstein once said, “Don’t listen to the person who has the answers; listen to the person who has the questions”.
With that, I will end with this final question…..

Post by meteorologist Jim Woodmencey
Taking our Temperature and Thermometers
Much is said these days about temperatures, but very little is told about how those temperatures are measured. There are various types of thermometers used at established weather stations, each uses slightly different instrumentation. Here I’ll describe the different types of thermometers used to take our temperature and how that instrumentation has changed over the years.
(Additional content was added to this post on July 31st, 2024)
A Brief History of Taking our Temperature
Daniel Gabriel Fahrenheit invented the first Liquid-in-Glass (LIG) thermometer in 1714. He started out using alcohol and then switched to mercury filled thermometers. An alcohol thermometer is preferred, especially in colder climates, because mercury freezes at minus 39 degrees.
Around 1850 the U.S. Weather Bureau began taking daily readings of temperature using Liquid-in-Glass thermometers at official weather stations. Most of those stations were in the eastern half of the United States at that time.
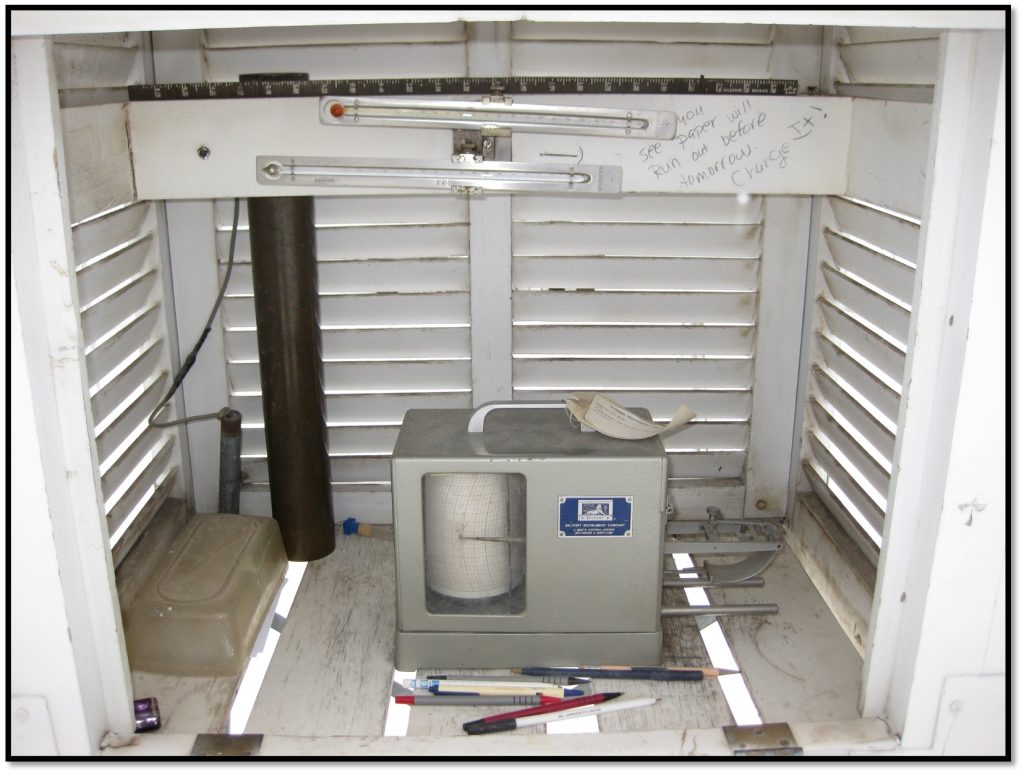
By the late 1870’s these weather stations began using two LIG thermometers, one that registered a maximum temperature and one that registered a minimum temperature. These thermometers were read once a day by a trained weather observer, to get a maximum and minimum temperature for the previous 24-hours and were reset manually each day.
By the mid-1880’s the standard was for these thermometers to be housed in a Stevenson Screen, later known as a Cotton Regional Shelter. These shelters were essentially large, white, louvered wooden boxes that protected the thermometers from wind, rain, and direct solar radiation. The shelters were also designed to allow good ventilation to negate any artificial overheating inside the shelter.
Fast forward another 100 years to the mid-1980’s, when the National Weather Service began changing the existing instrumentation over to an electronic thermometer. These could log temperature readings automatically, eliminating the daily routine of reading and resetting the thermometers. This provided a more consistent recording of the data, with fewer missed days in the daily weather records.
By the late 1990’s, about two-thirds of all official weather observing stations across the U.S. had been changed over to electronic thermometers. Today, almost 100-percent of the official thermometers maintained by the National Weather Service are electronic.
Electronic Thermometers
The modern Maximum-Minimum Temperature Sensor (MMTS) used today is an electronic RTD type thermometer, or Resistance Temperature Detector, which measures electrical resistance in a coiled metal wire. As temperatures rise or fall, electrical resistance rises or falls, in a linear fashion.
The RTD-type thermometers used at official weather observing stations today have proven to be as precise as the LIG-types, both are accurate to within about 0.5 degrees F. The biggest difference is that RTD thermometers have a much faster response time than LIG thermometers. Which means, brief spikes in temperature, high or low, will be recorded by an RTD. An LIG thermometer cannot record those spikes, as it takes longer for the liquid to react.
RTD thermometers are more sophisticated, more accurate, and more stable than simple thermistor-type thermometers, like you would find in a home weather station or your car. Many of the remote weather stations in the mountains utilize a thermistor-type thermometer, which in many cases are not shielded properly and susceptible to erroneous readings, like your car’s thermometer is.
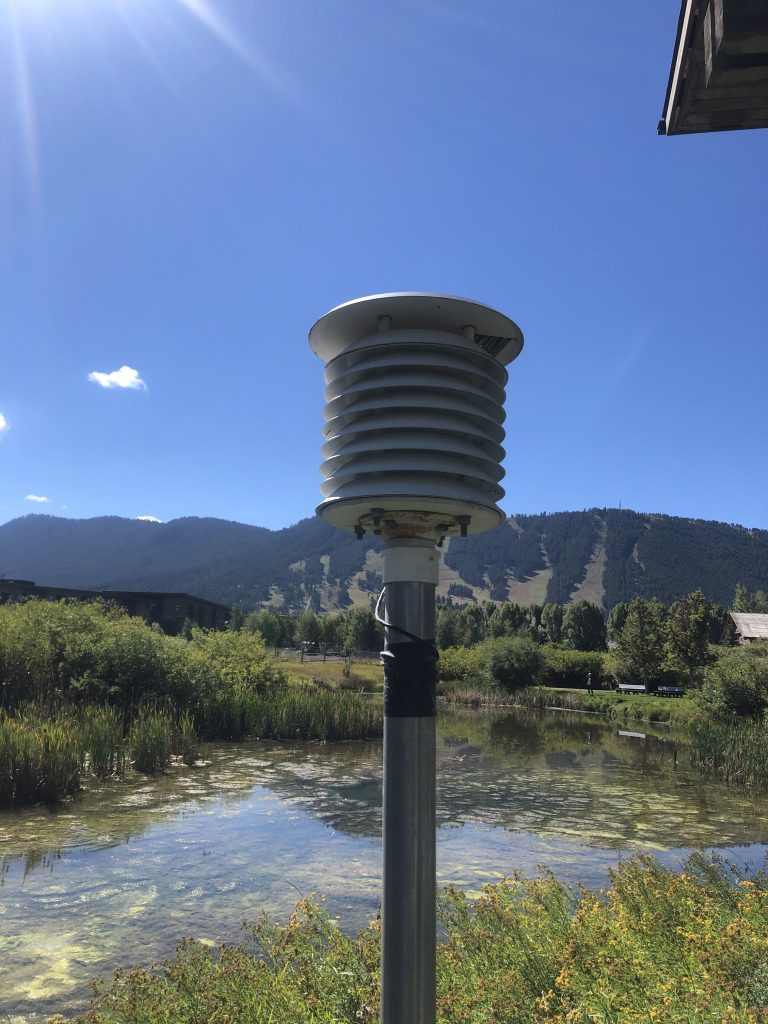
The new MMTS thermometers are not housed in the old type of shelter, but rather inside a beehive shaped, vented canister. Which, I have discovered, the size of the beehive canister is not standard from one weather station to another. That creates an issue, which I will expound upon shortly.
Jackson, WY Instruments
The earliest official weather readings here in Jackson, WY began in 1899, although only for about a month. By 1916, the primary weather station in town, located behind the Forest Service office on North Cache Street, began taking more regular readings. But it wasn’t until about 1950 that records became more consistent year-round. Back then, and until the early 2000’s, LIG-type thermometers were used.
In March of 2002 the Jackson Climate Station switched over to an electronic MMTS thermometer. In October of 2012 the station moved a few hundred yards to the North, to behind the Visitor Center.
Because Jackson’s weather station has always bordered the natural setting of the Elk Refuge and has been in roughly the same location for over 100 years, I believe the Jackson Climate Station has one of the best long-term temperature records available anywhere in the country.
A weather station that has remained in a more natural setting, away from concrete, asphalt pavement, and large buildings, provides more realistic historical temperature readings. Jackson’s station is unlike most weather stations around the U.S., which have seen big cities grow up around them.
Jackson vs. Moose Wyoming Instruments
I have resided in the Jackson Hole valley for over 40 years now and in that time, I have observed and researched our weather and climate, about as extensively as anyone could. Over the years I have seen some changes, not only in the weather, but also in the instrumentation used to measure temperatures.
While analyzing monthly weather data from the Jackson Climate Station, located on the north end of town with the Moose Climate Station in Grand Teton National Park, I discovered that a change in equipment yielded different results. Somehow Moose had become warmer than Jackson, on certain days, which historically has never been the case. Allow me to explain why.
The Stations
Both Jackson and Moose are Cooperative (COOP) weather stations established and maintained by the National Weather Service. Each day, trained weather observers take readings from these weather stations and submit the data to the National Weather Service, which is then transmitted to the National Climatic Data Center.
Both Jackson and Moose have long-term records, and these records establish what we refer to as our climate, the compilation of monthly averages over a minimum of a 30-year period. They are also the stations referenced when a new record high or low temperature is established.
Jackson’s station has been in roughly the same location since the early 1900’s. The Moose weather station was originally located at Beaver Creek, then in 1958 it moved to Moose, behind the Park Headquarters building. In 2018 the station moved across the road, close to new Visitor Center.
Jackson switched from Liquid-in- Glass to a digital-type thermometer in 2002. Moose changed equipment when the station moved in 2018.
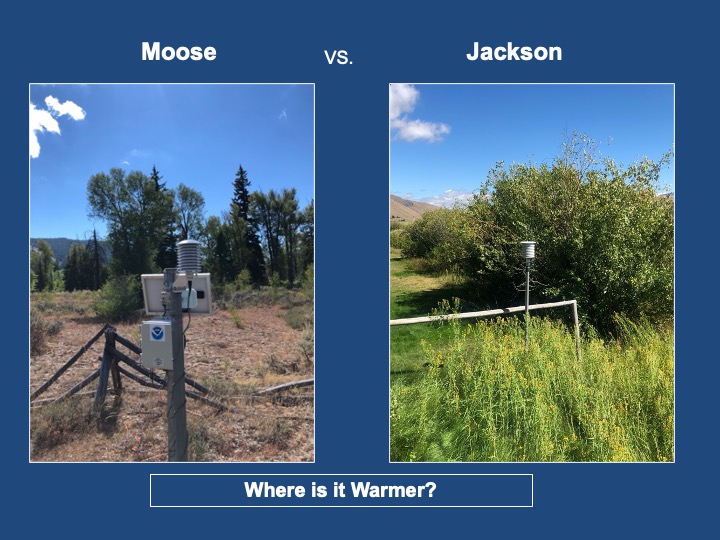
The Moose station now sits over dirt and sparse sagebrush, whereas the Jackson station sits over grass. The underlying surface can influence temperatures, as dirt heats up more readily than green grass. Initially, when I observed that Moose was recording higher daytime temperatures than Jackson, I thought it was because of the Moose station’s new location. Further investigation led me to a different conclusion.
Size Matters
Where these two weather stations now differ is in the housing that shields the thermometer. The “beehive” housing that protects the thermometer is supposed to be of a standard size. The Jackson housing, made by Airflo, meets the NWS standard. The Moose housing, made by Nimbus, is about half the size of Jackson’s housing. I am not sure why or how that happened. The NWS told me there was a vendor change before the Moose station was installed.
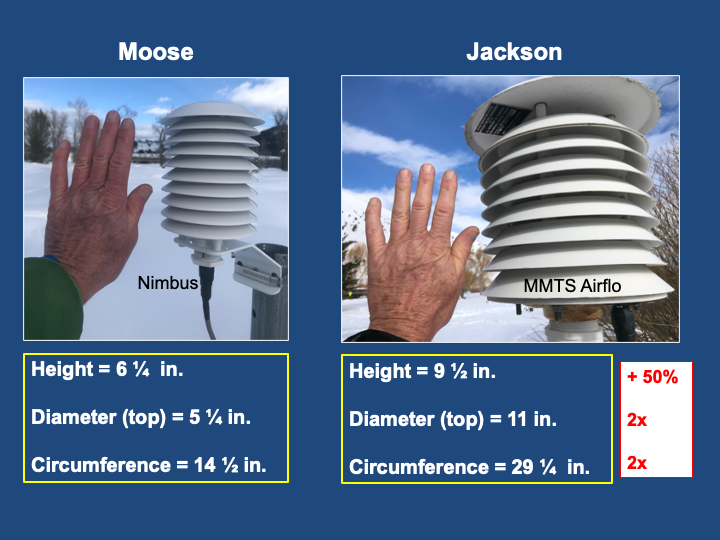
Why is this important? Because thermometers need good air flow around them to get an accurate reading of the true air temperature. A larger housing allows better ventilation, or aspiration. A smaller housing does not allow good aspiration and can lead to higher temperature readings, most notably on sunny days, with calm winds.
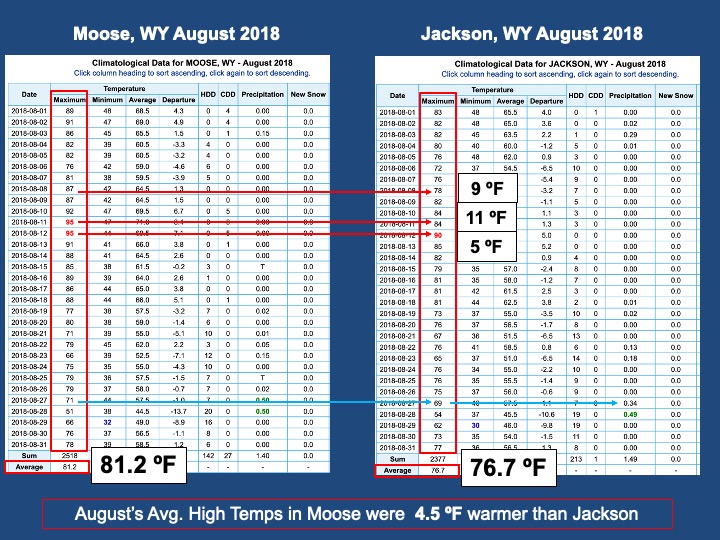
This became glaringly evident when I saw the average monthly high temperatures in August of 2018 that were nearly 5 degrees warmer in Moose than they were in Jackson. On the warmest and driest days of that month, Moose had daily high temperatures that were 9 to 11 degrees warmer than Jackson’s. That is just not realistic.
Going back to a time when Liquid-in Glass thermometers were being used, I looked at the records from August 1988, one of the hottest and driest summers up to that point. What I found was that Jackson’s average high temperature that month was about 2 degrees warmer than Moose. On the warmest days of that month, Jackson had temperatures that were 5 to 8 degrees warmer than Moose. That’s much more reasonable.
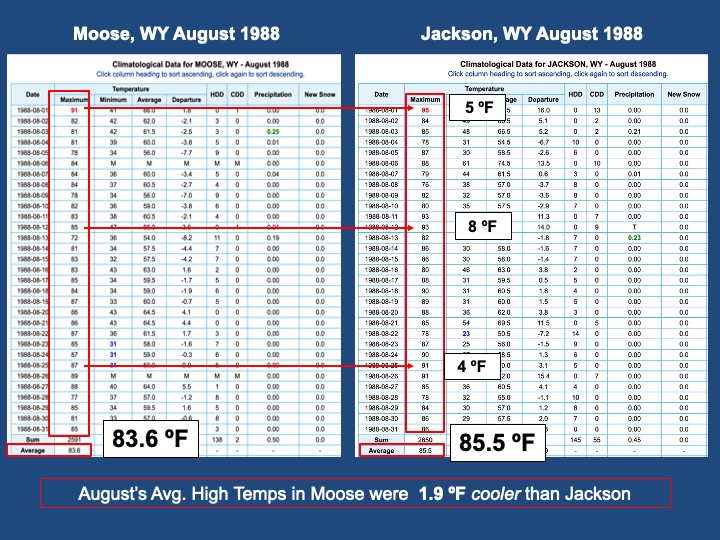
So, between 1988 and 2018, Moose changed from being about 2 degrees cooler than Jackson in August to being almost 5 degrees warmer than Jackson in August.
I can only speculate that the discrepancy is in the size of the housing and how well they are able to aspirate. A smaller thermometer housing yields higher temperatures on a sunny day than the same type of thermometer housed in a larger beehive.
There is one more thing that might have been affecting the Moose thermometer, and that is the fact that it is a wireless system, it requires a solar panel to keep the battery charged. Unfortunately that panel is very close to the thermistor housing and may be adding additional heat to the max temp readings, especially on those sunny days!
(See photo below).
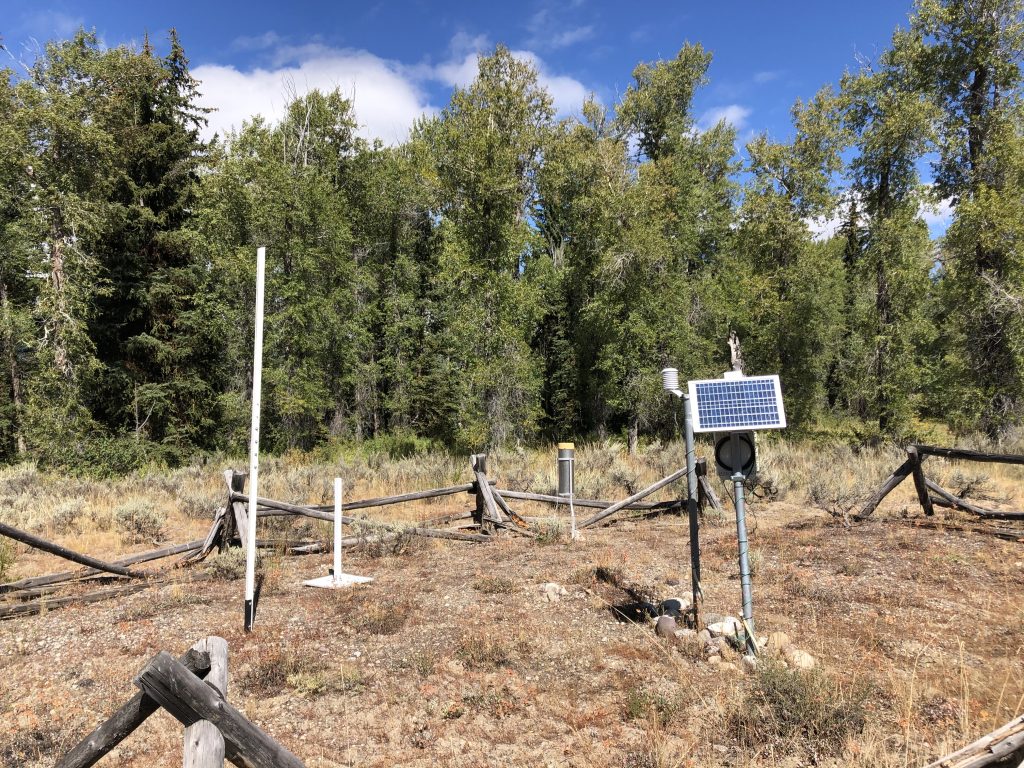
Further investigation showed that overnight low temperatures, temperatures on cloudy or rainy days, and wintertime temperatures when there was snow on the ground, were less affected, and little discrepancy was noted.
The problem with this change in thermometer types the last 20 years, and more so with the discrepancy between thermometer housing sizes, is that our temperature records are no longer consistent. Those inflated high temperatures in Moose become part of the long-term record and comparing them to records prior to 2018 has become apples and oranges.
(Note: The Moose thermometer has been inoperable and not recording temperatures since May 23rd, 2024. I am told by the NWS they are working on fixing that. Hopefully they switch out the beehive to one that is closer to the standard size specified by the NWS, and also move the solar panel further away from the thermometer too!)
It makes me wonder what other weather stations around the country are experiencing a similar effect with their newer instrumentation as we are seeing here in Jackson Hole.
As Robert Mallet said in the Manual of Scientific Inquiry, back in 1859, “Nature, rightly questioned, never lies.”
Post by meteorologist Jim Woodmencey
Morning T-storm
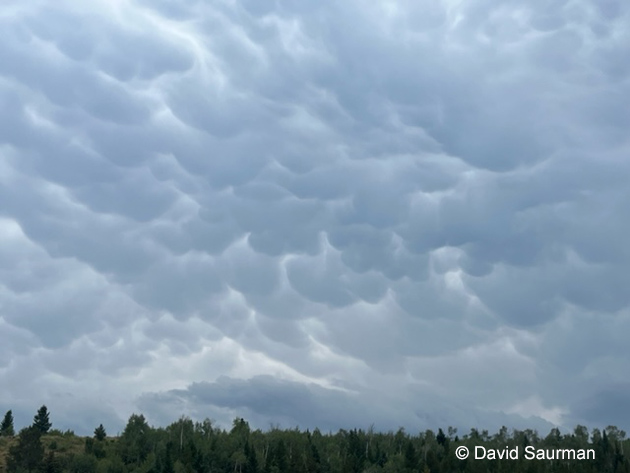
Storm Clouds Tetons
Cool Clouds
Springtime in the Tetons
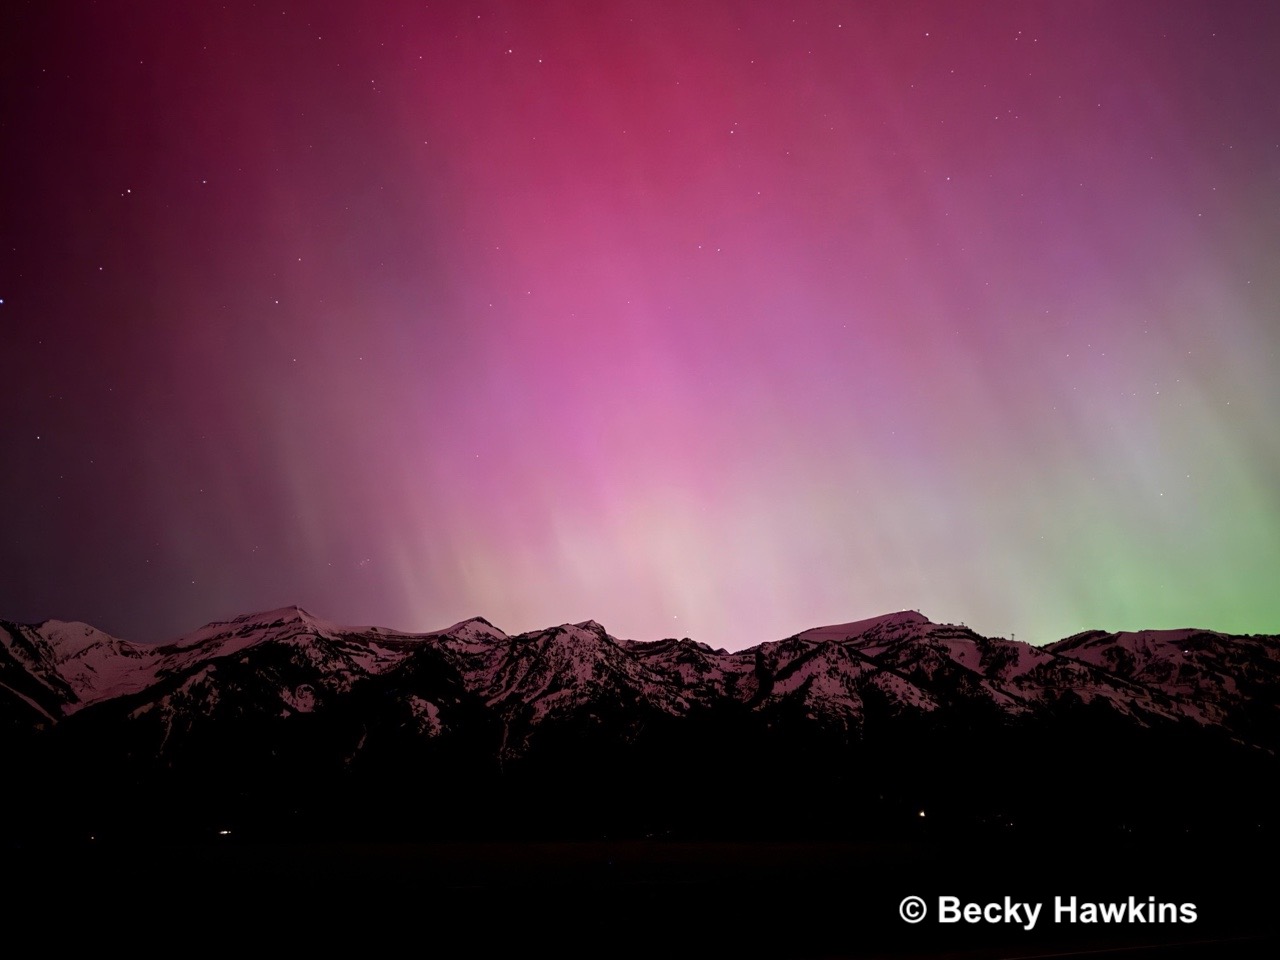
Aurora Borealis
Moonrise over Cache Creek