
All posts by Jim Woodmencey
Plume on the Grand

Jackson Trends Colder, Wetter & Snowier than Normal
The bottom-line for the year 2022 in Jackson, Wyoming was, it ended up much colder, much wetter and much snowier than normal. As a matter of fact, the overall trend for the last seven years now has been leaning in those directions.
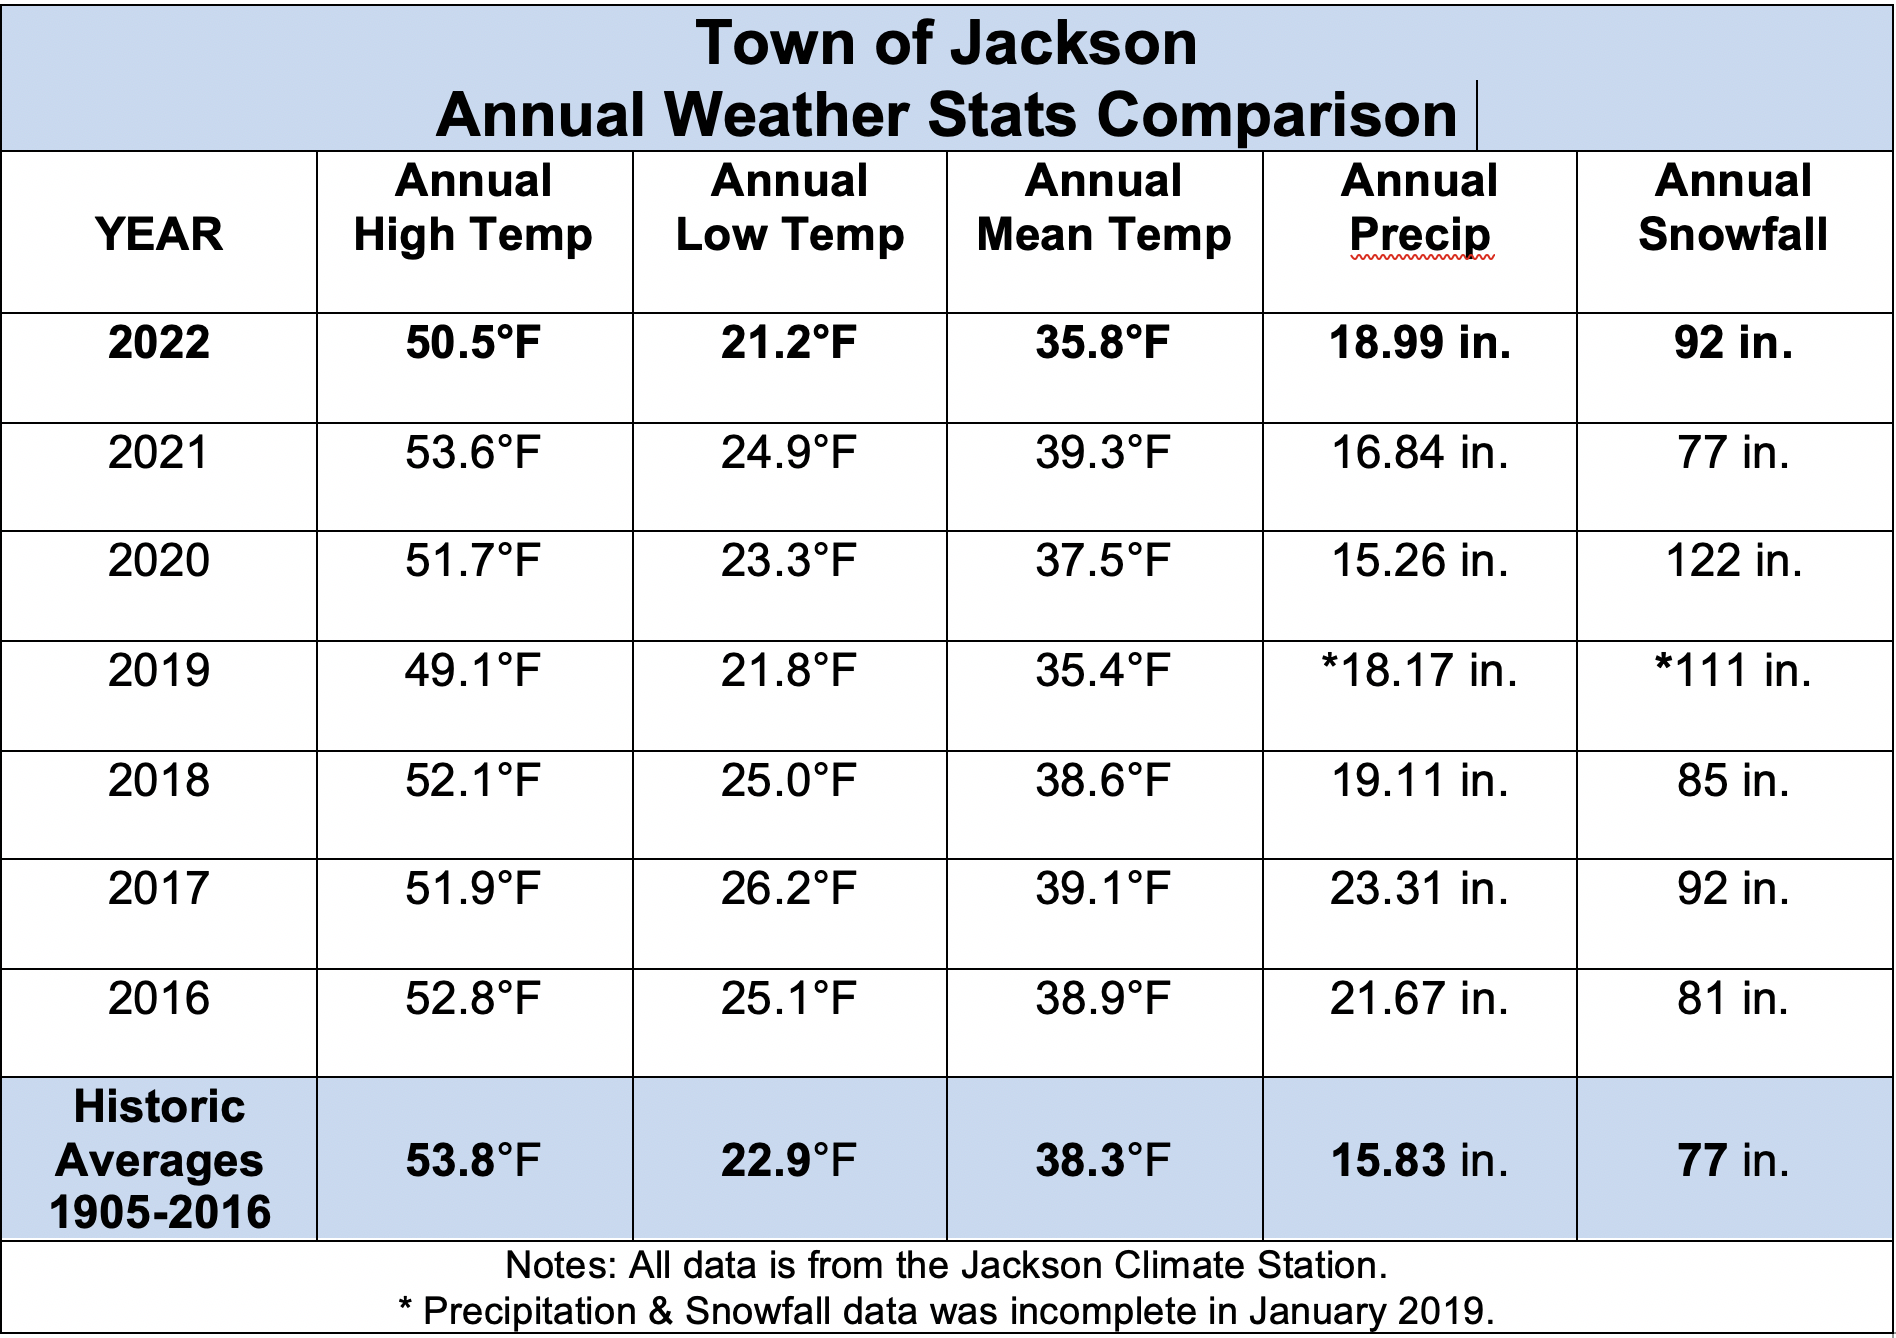
Below is a full review of all the weather statistics from the Town of Jackson’s Climate Station, showing how 2022 compares to recent years and to the long-term averages. I’ll begin by looking at the temperatures and wrap it up by looking at precipitation and snowfall numbers. You can also refer to the summary table at the end of this post.
Colder Temperatures in 2022
Nine out of twelve months in 2022 had colder than normal temperatures, including the coldest November ever recorded in town and the 7th coldest April on record. March and September were the only two months in 2022 that had warmer than normal temperatures. July ended up right at average, temperature-wise.
The average high temperature for the entire year was 50.5 degrees Fahrenheit. That is more than three degrees colder than the long-term historic average annual high temperature of 53.8 degrees. Officially, the hottest day of the year in 2022 at the Jackson Climate Station was 89 degrees on July 17th.
The average low temperature for the year was 21.2 degrees, or almost three degrees cooler than the long-term historic average annual low temperature of 22.9 degrees. The coldest days of the year in 2022 were on December 22nd and 23rd when it reached 25 below zero on the official town thermometer.
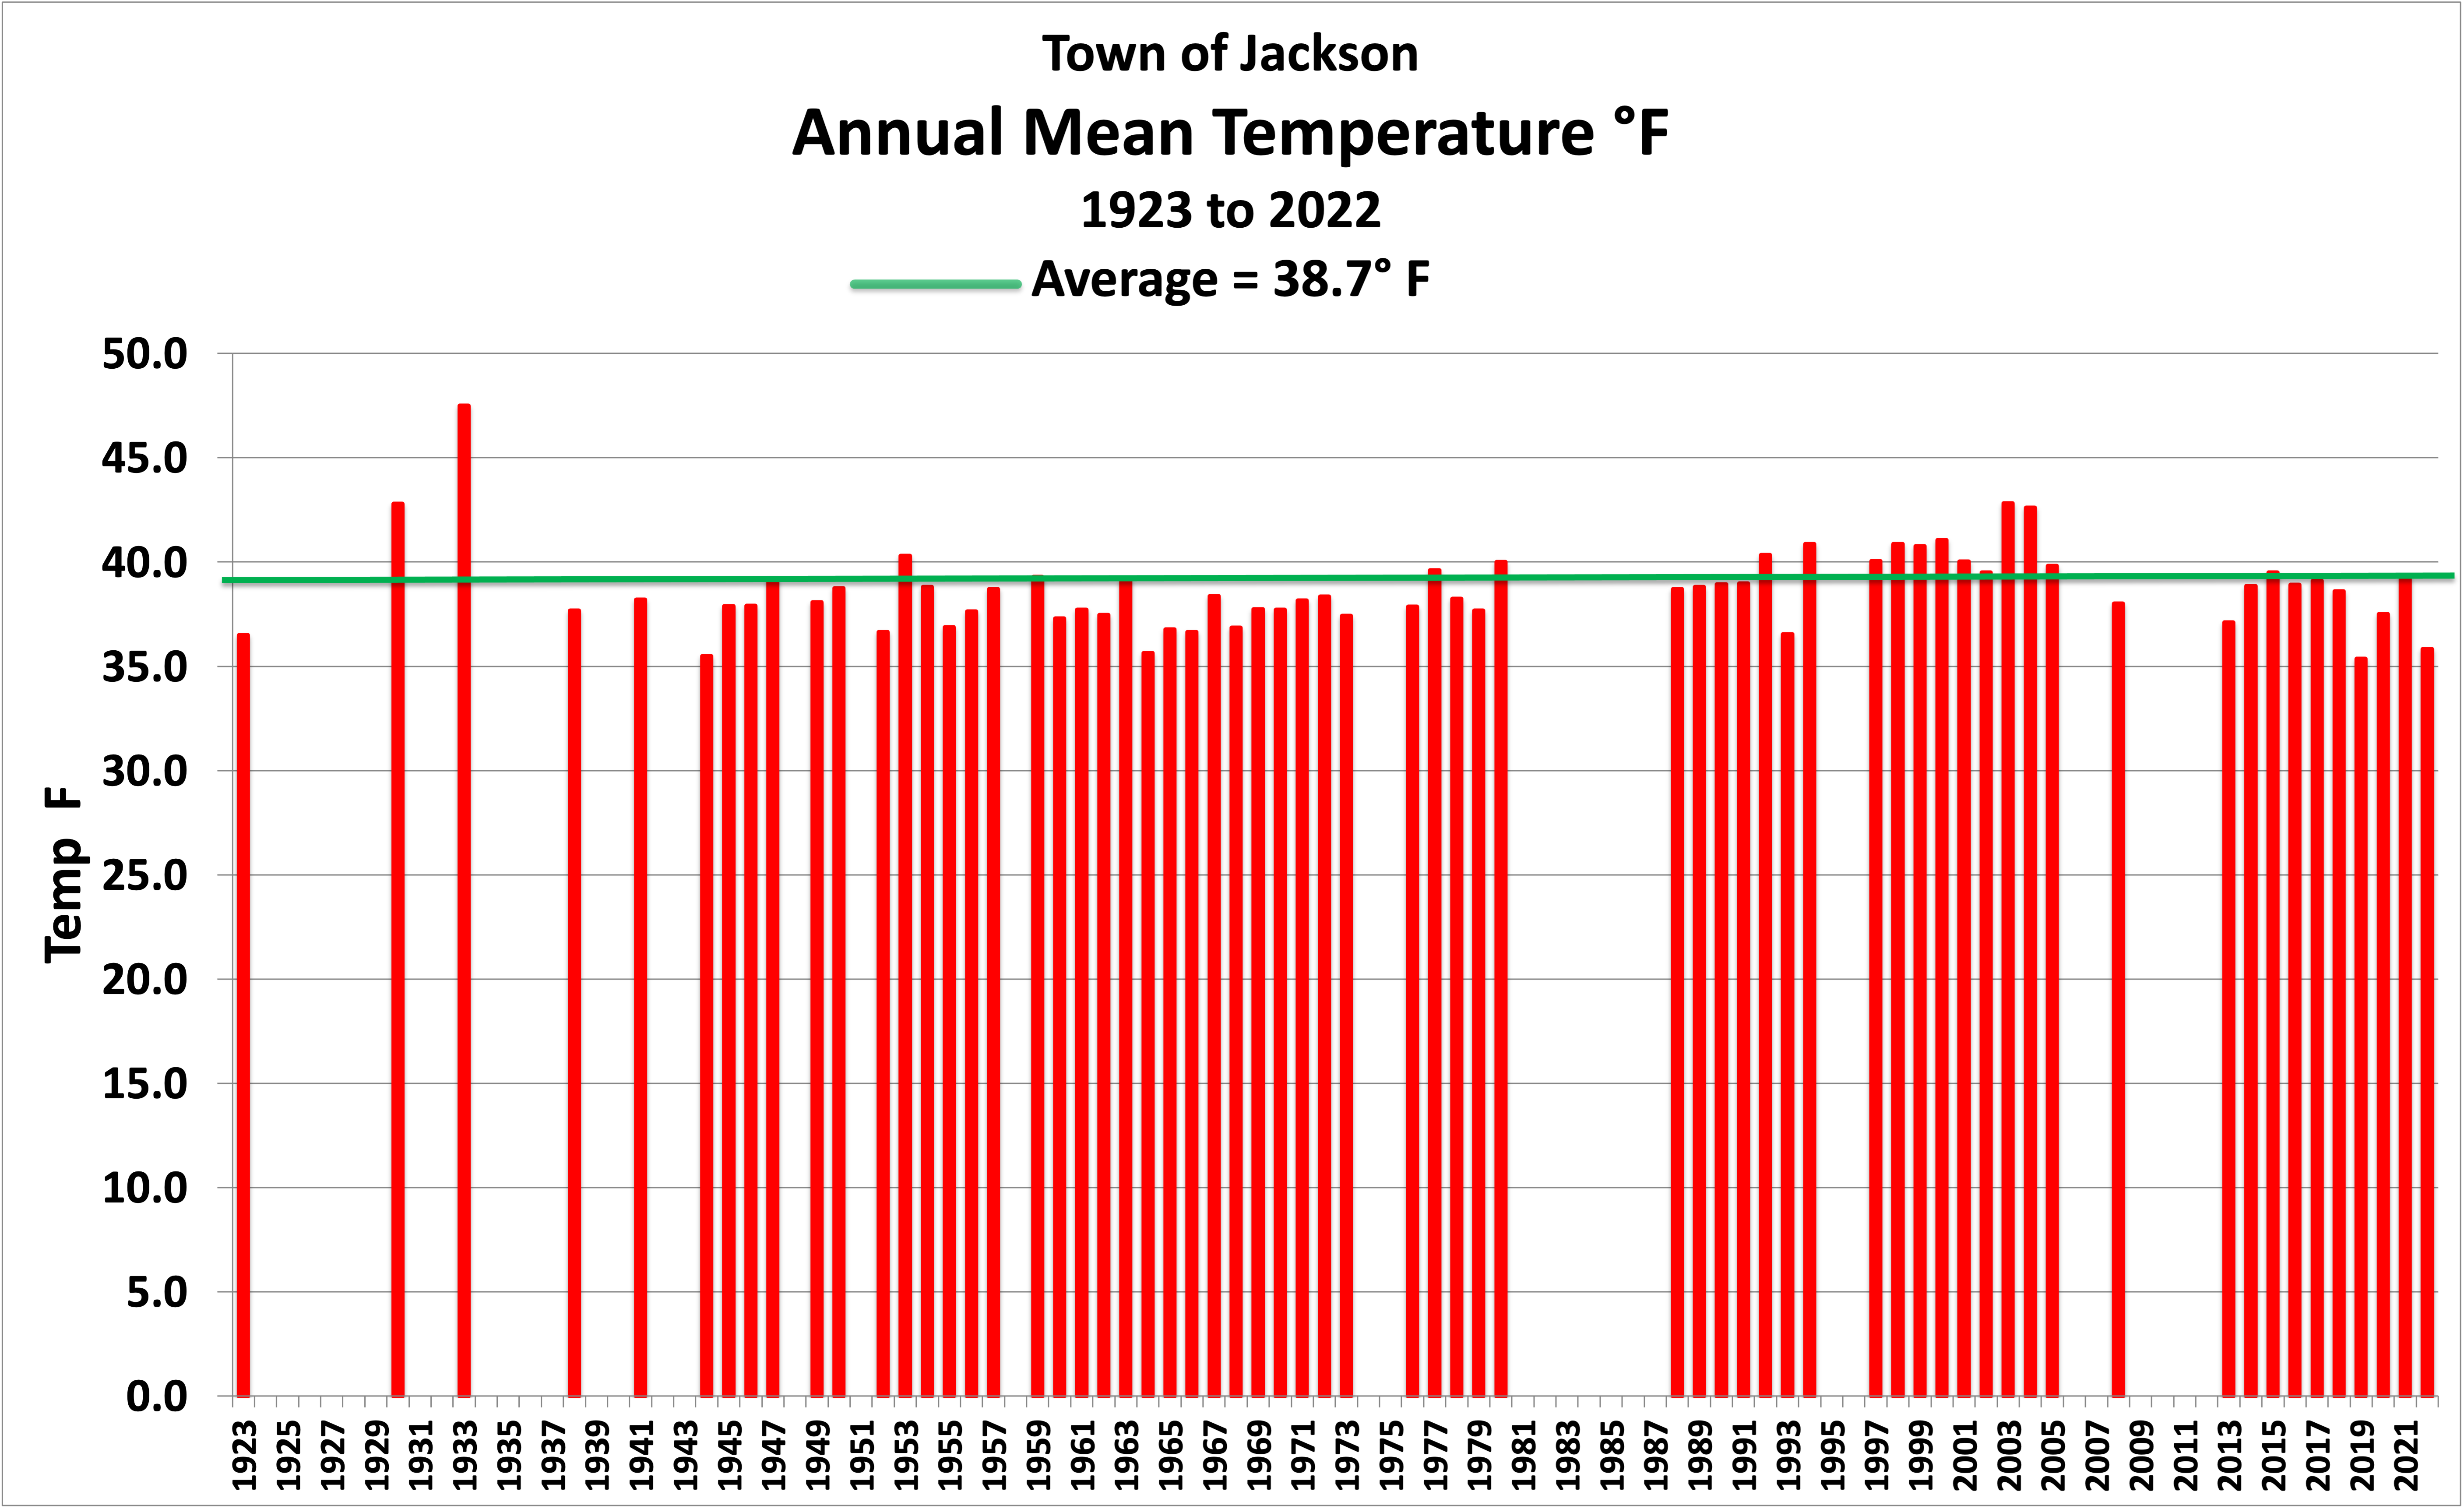
The annual mean temperature for 2022, the average of the annual high and low temperatures, checked in at 35.8 degrees. Jackson’s long-term average annual mean temperature is 38.3 degrees. That is 3.5 degrees colder than normal, making 2022 the fourth coldest year on record for the Town of Jackson.
(See graph of annual Mean Temps below).
You may recall it was only three years ago that Jackson had its coldest year ever recorded, in 2019. The annual mean temperature that year was 35.4 degrees, beating the old record from 1944 of 35.5 degrees, by one-tenth of a degree. Besides 2019 and 1944, the only other year colder than this past year was in 1964, with an annual mean temperature of 35.6 degrees.
Precipitation Above Normal
Jackson received a grand total of 18.99 inches of precipitation in 2022. That is more than three inches above the historic average. Amazingly, that number was reached with six months of the year receiving below normal precipitation, and the other six months receiving above normal precipitation.
Precipitation came in an alternating pattern of dry and wet. January, February, and March were all drier than normal. April and May were wetter. June was near average, and July was bone-dry. August was very wet, ending up as the wettest month of the year in 2022, with 3.65 inches for the month. September was wetter than normal. October was also very dry, then November and December 2022 were both much wetter than average.
In the last seven years, there has only been one year that the Town of Jackson has had precipitation that was below the long-term average. That was in 2020, when the precipitation total was 15.26 inches, a little more than a half-inch below average. Historically, the average annual precipitation in town, from years with complete data between 1905 and 2016, is 15.83 inches.
Snowfall Above Normal
Snowfall to start the year 2022 was nothing to write home about. January, February, and March only recorded a total of about 30 inches of snowfall in the Town of Jackson. The average snowfall for those three months in town is closer to 45 inches. Then came April, with just over 17 inches of snowfall, when normally Jackson averages only 4 inches for the month.
April of 2022 became the third snowiest April in town, behind the 18 inches in April of 1963, and the 24 inches in April of 1967.
Skipping ahead to the end of the year, both November and December of 2022 were above normal for snowfall in town. November added just over 20 inches of snow and December another 22 inches to the annual total.
The final tally of annual snowfall in the Town of Jackson, January through December 2022, was 92 inches. That’s about 20 percent more than the long-term average for annual snowfall in town of 77 inches.
For those who think it just doesn’t snow like it used to, look at the table. Six out of the last seven years have ended up with above average snowfall in town. Last year, 2021 was the only year that wasn’t, and even that year checked in right at the long-term average of 77 inches.
The last year that had below average snowfall in town was in 2015, with 58 inches. But in 2014, Jackson had 101 inches of snowfall.
Summary
These most recent seven years that are listed in the table are starting to show a trend, when compared to Jackson’s long-term historic averages. That trend has been towards colder – especially regarding high temperatures – towards wetter, and towards snowier weather in Jackson. I would think that is all good news and should dispel any myths about becoming warmer, drier, and less snowy.
Jim is the chief meteorologist at mountainweather.com and has forecast the weather in Jackson Hole for over 30 years.
Blue Sky Day

December 2022 Temperature Roller Coaster
Temperatures during the last month of 2022 took quite a roller coaster ride in the Town of Jackson, WY. More than once during the month we experienced temperature swings, both up and down, of over 50 degrees Fahrenheit.
Depending on the upper level flow direction at the time, which determined if temps were going up or going down, some of those changes occurred in a very short period of time.
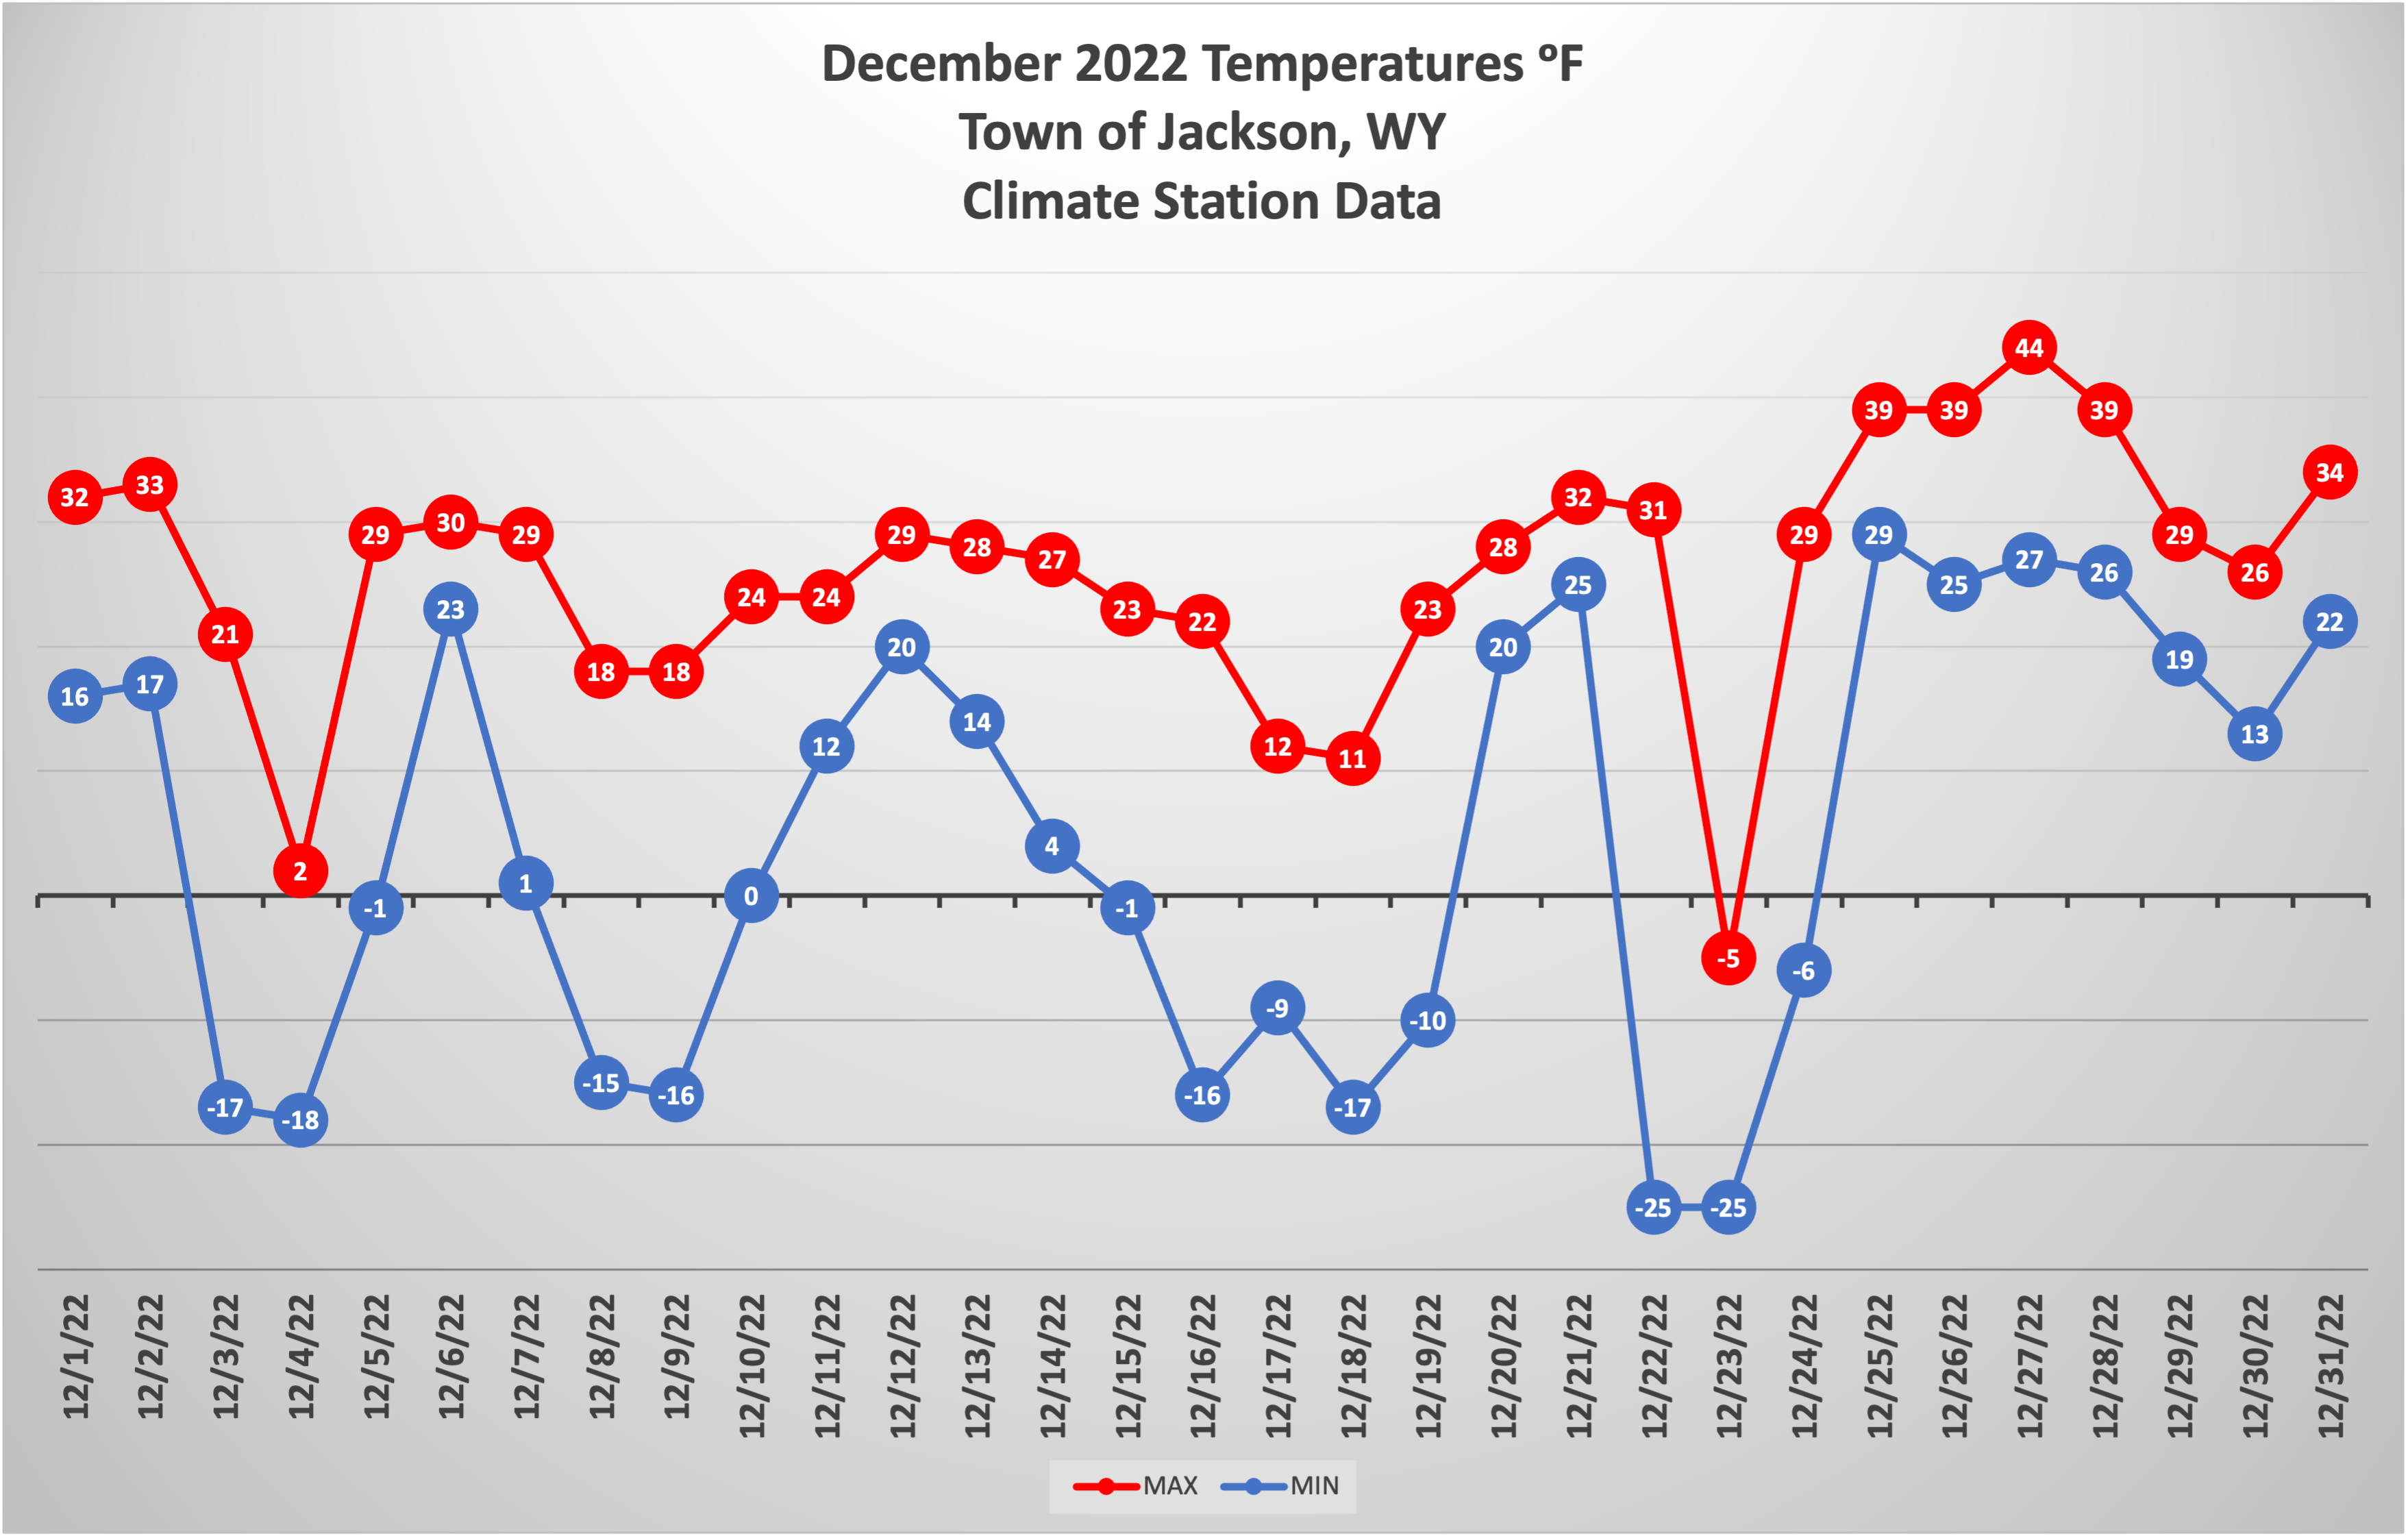
The swinging pendulum began at the beginning of the month with a 50 degree change in temperature from a high of 33 degrees on the afternoon of December 1st (temps are recorded each morning at 9:00 am local time for the previous 24-hours). The low temp on December 3rd was minus 17 degrees. A 50 degree drop in just 2 days.
Two days after that, on December 5th, the high was back up to 30 degrees above zero, a 48 degree rise in temperature. Followed by a drop back down to 15 below zero on December 8th, a 45 degree change in the other direction.
The biggest plummet of temperatures though occurred on the Winter Solstice, December 21st to 22nd, 2022. That was followed just a few days later by a significant resurrection of temperatures. Here is how that story unfolded.
Cold Solstice
The Winter Solstice arrived with some gusto this year in Jackson Hole, with near blizzard conditions, followed immediately by a blast of Arctic air from the north that had temperatures dropping to 25 degrees below zero Fahrenheit.
The official high temperature at the Jackson Climate Station on December 21st, 2022 actually occurred in the morning, when it reached 31 degrees before 9:00 a.m. The low temperature the following morning, December 22nd, was 25 degrees below zero, a 56 degree drop in 24 hours.
Warm Christmas Weekend
It was also 25 below zero on December 23rd. Three days later, on the afternoon of December 26th, a southerly flow of air brought the high temperature all the way up to 44 degrees in the Town of Jackson. That’s a 69 degree rise in temperature in three days time.
Talk about a hard place to dress for!
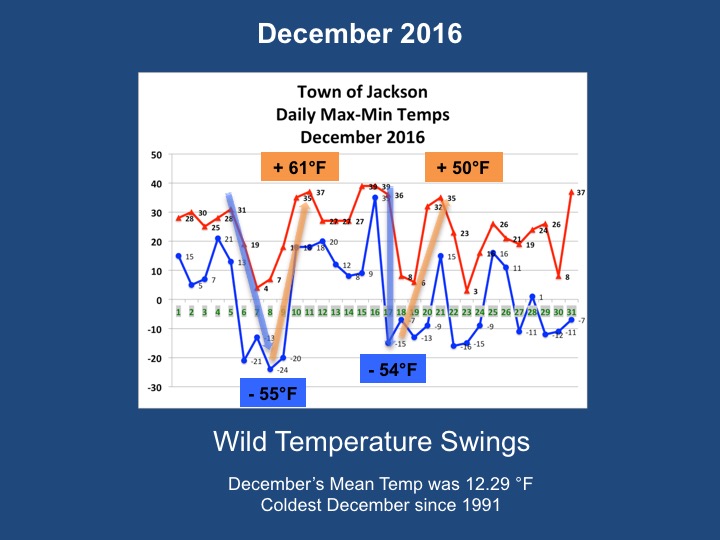
Similar to 2016
Yes, those were unusual temperature swings. But we saw a similar roller coaster of temperatures in December of 2016. There were 50 and 60 degree temperature swings in Jackson that December, as well.
Here is what that month looked like:
Record Cold in Casper, Wyoming
Perhaps the most impressive temperature drop I could find in Wyoming over the Winter Solstice this year was in Casper, WY. On the morning of December 21st, 2022, Casper’s airport thermometer went from 28 degrees above zero at 7:40 a.m. to 6 degrees below zero at 8:40 a.m. when the Arctic air arrived. That’s a temperature drop of 34 degrees in one hour.
Twenty-four hours later, on the morning of December 22nd, the low temperature in Casper was 42 degrees below zero. A precipitous cold plunge of 70 degrees from the previous morning’s reading of 28 degrees above zero.
That minus 42 degree reading broke Casper’s all-time cold temperature record. Prior to this December, the coldest temperature ever recorded in Casper was minus 41 degrees, on December 21st, 1990.
Posted by: meteorologist Jim Woodmencey
Mid-Layer Fog Tetons

Alpenglow

Mountain Stratus

Coldest November Ever in Jackson, WY
November 2022 was the coldest November on record in Jackson, Wyoming. Let me repeat that, to let it sink in, this November was the coldest November Jackson has ever experienced. And that’s saying something, because it happened without breaking a single daily temperature record in November.
The month of November was just consistently cold, with 12 days reporting morning low temperatures that were below zero Fahrenheit. The average low temperature for November 2022 was 6.2 degrees, which is a full 10 degrees colder than Jackson’s long-term average monthly low temperature in November.
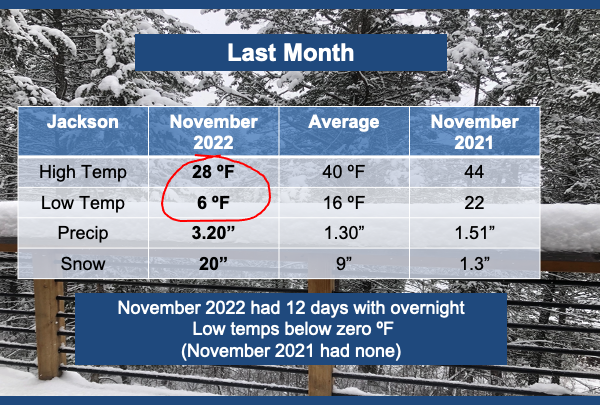
The average high temperature in November 2022 was 27.7 degrees, which is an amazing departure from the long-term average of 40 degrees in the month of November. That is a full 12 degrees colder than normal!
The coldest day of the month was on November 19th, 2022, with a low temp of 13 degrees below zero and a high temp of 11 degrees above zero.
Compared to one year ago, November, 2021 had no days with below zero temperatures and average high and low temperatures that were both several degrees above normal.
A Big Deal
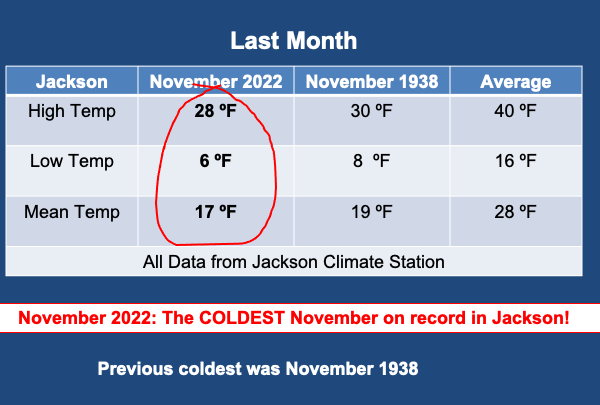
The mean temperature for the month of November 2022 (the average of the average high and low temperatures for the month) was 17 degrees, which is 11 degrees below the long-term average mean temperature for the month of November.
All of this qualifies as the coldest November on record, going back through about 100 years of records. The previous coldest November in Jackson was 84 years ago, in 1938. The mean temperature that month was 18.8 degrees. No other month with complete records even comes close.
(Numbers in graphics are rounded up or down to whole numbers for simplicity).
This might very well be one of the largest differences between the long-term average temperatures and new record temperatures that I have seen in my 30 years of compiling and studying the weather stats here in Jackson.
Period of Record Stats
Long-term records refer to the entire period of record for a climate station. Jackson’s records date back to the early 1900’s. However, in analyzing monthly temperature averages like this, you have to throw out the years with incomplete records. Any month with more than 5 days of missing data is disqualified from this analysis.
The chart below shows all the years with complete data to calculate a monthly mean temperature in November, about 86 years that met the criteria.
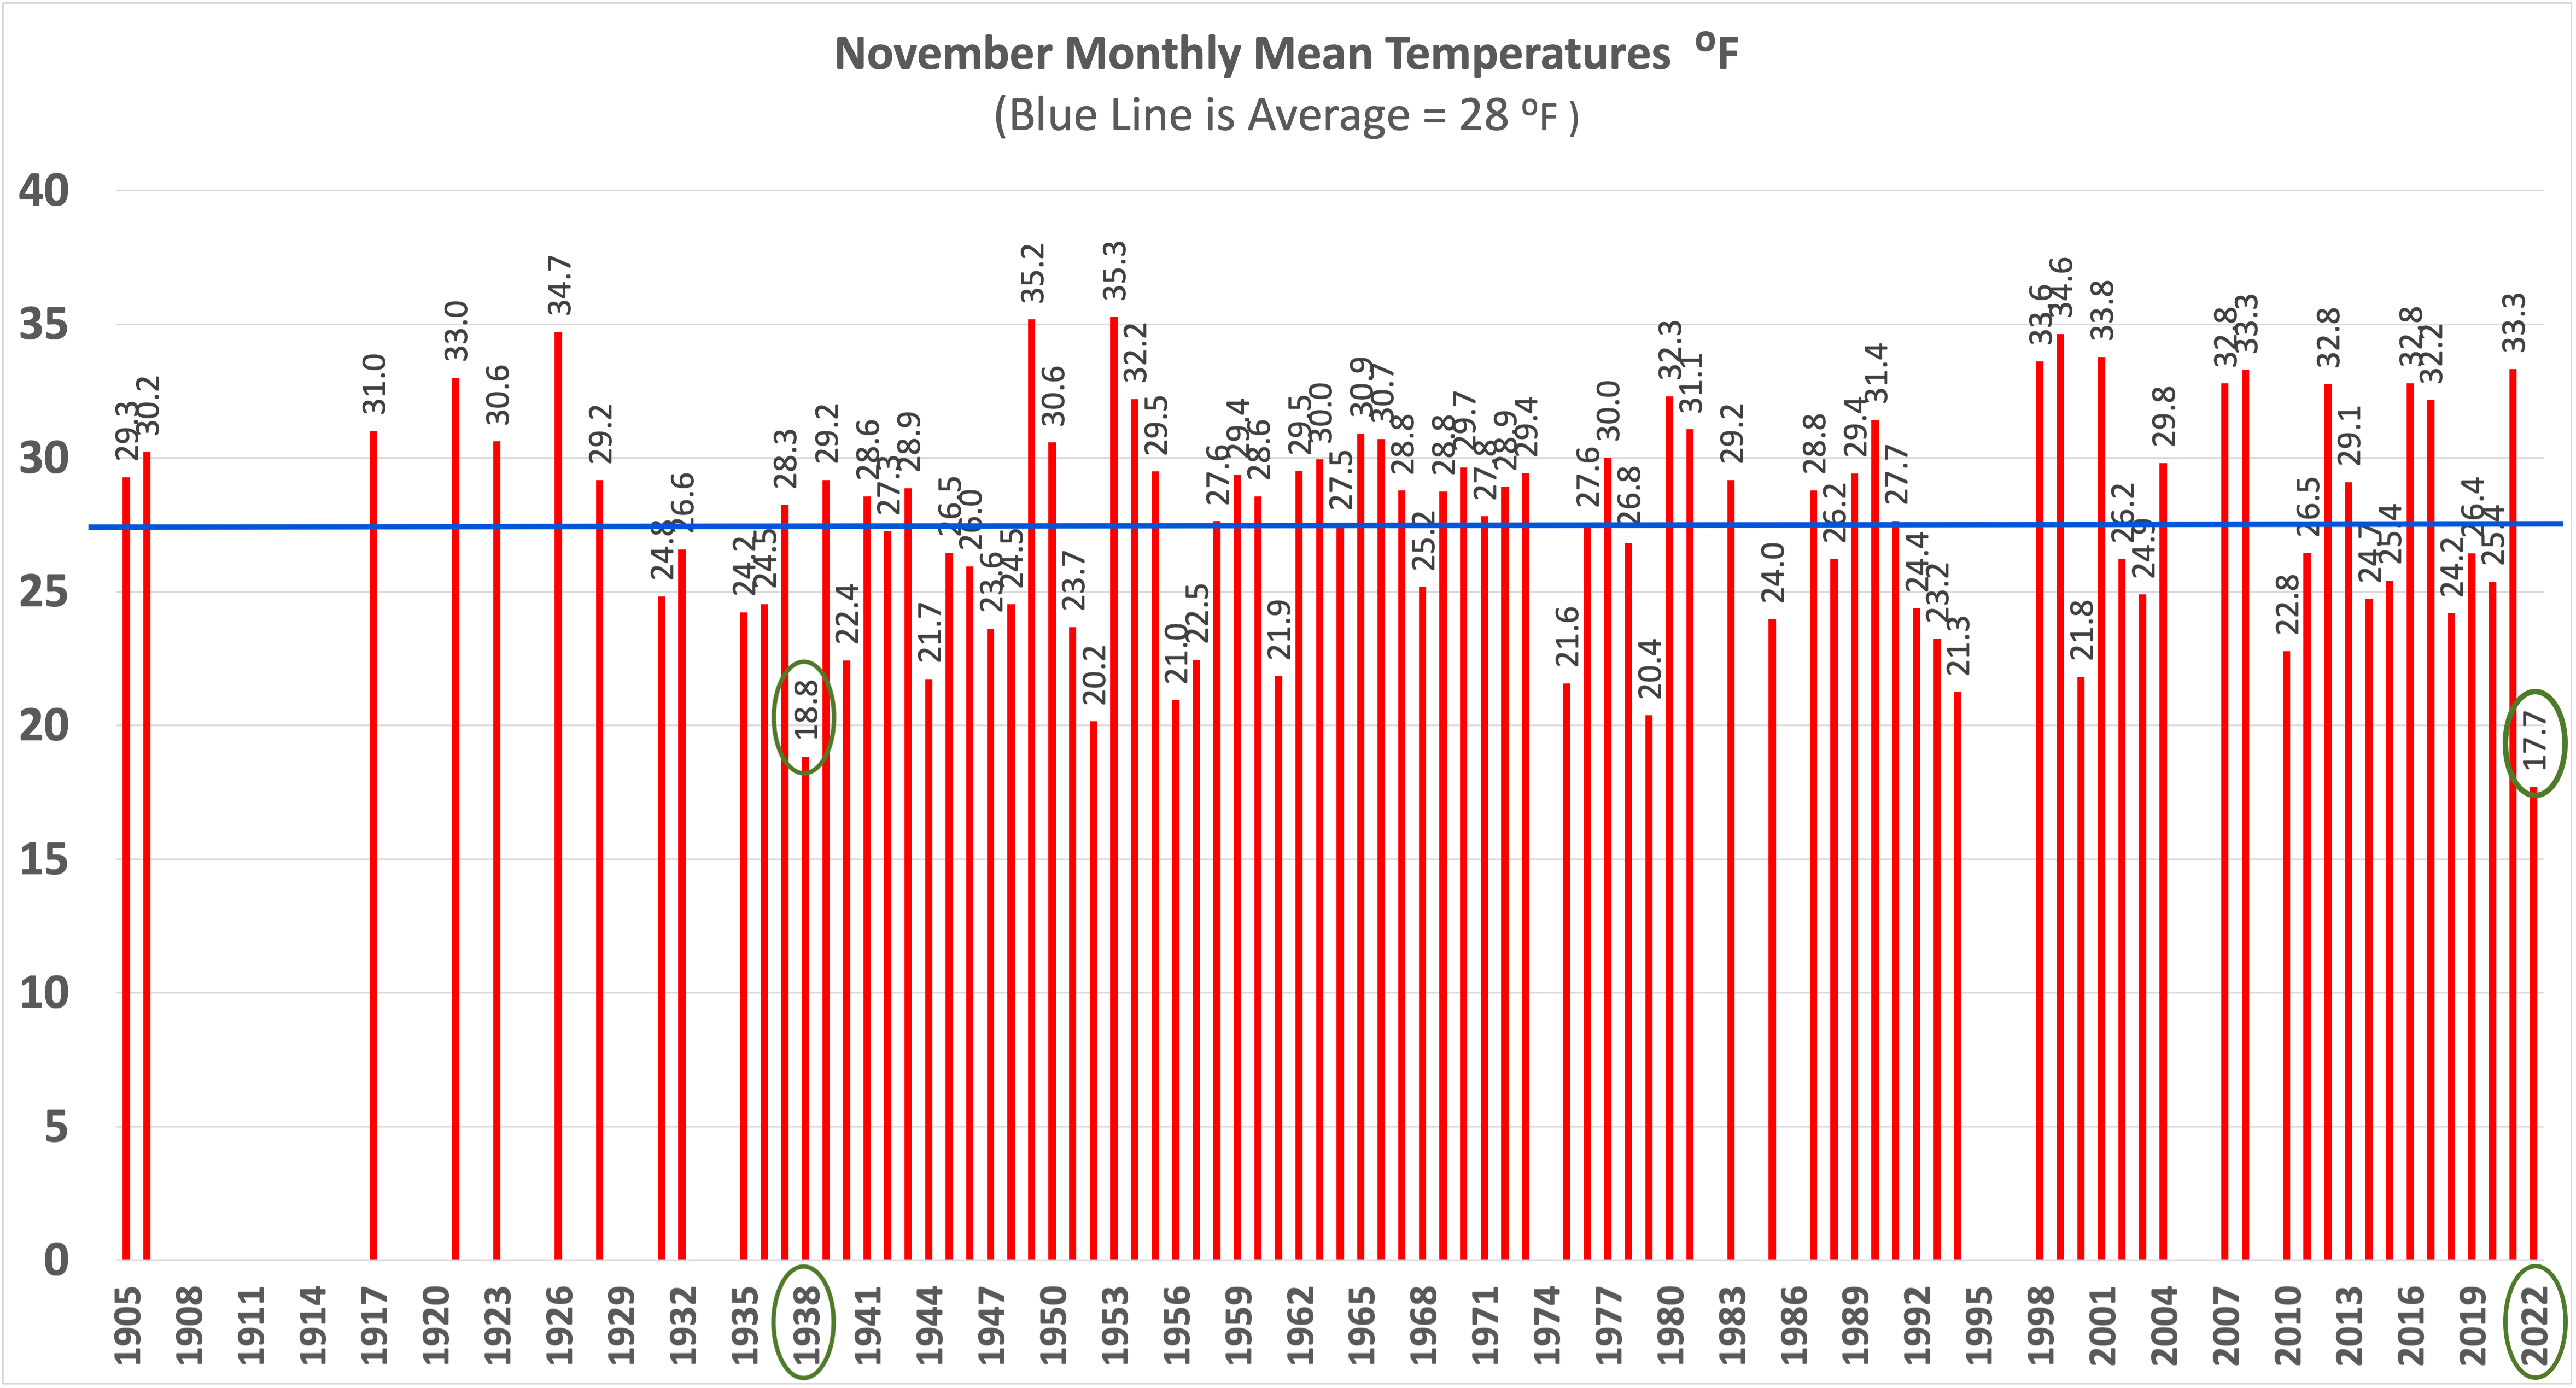
By the way, if you think November was somehow a one-off, it was not. In recent times, October of 2019 was the coldest October on record, and 2019 was also the Coldest Year on Record in Jackson.
All data is from the Jackson Climate Station, which is located on North Cache Street in Jackson, WY.
Posted by meteorologist Jim Woodmencey of MountainWeather.com
December 5th, 2022
Dusk in the Tetons
