To no one’s surprise, June 2012 was warm & dry. It was not the hottest June ever by any means, but it was certainly one of the driest on record. I will review temperatures first and then the precipitation, or lack thereof!
Temperatures
The average high temperature in the Town of Jackson during June 2012 was 75 degrees, or about 3 degrees warmer than normal. The average low temperature was 38 degrees, and only about 1 degree warmer than normal.
That would make for an average “mean” temperature for the month of 56.5 degrees, which is about 2 degrees warmer than the historic average for June.
Although we had 10 days in June that were 80 degrees or warmer, we also had a number of days that were well below normal, with highs only in the 50’s. That certainly prevented June 2012 from being ranked among the hottest. There were many other years, especially in the 1990’s and early 2000’s that experienced warmer Junes. None of those were able to top the warmest June ever, which was June 1988. The average mean temperature back then was 61.4°F.
Precipitation
You would have to go all the way back to 1935 to find a drier June in Jackson Hole, when only 0.17 inches of rainfall was recorded. This June we had 0.20 inches.
Even June of 1988 saw more precip, with 0.35 inches of rainfall for the month. But that summer went on to be the hottest & driest on record, with no precip in the entire month of July and a scant 0.45 inches in the month of August.
That 0.20 inches this June was way below our normal June precip of 1.65 inches, by almost am inch and a half!
|
June 2012 vs. June Historic Averages
|
|
|
Avg. High Temp = 75°F
|
Normal High = 72°F
|
|
Avg. Low Temp = 38°F
|
Normal Low = 37°F
|
|
Avg. Mean Temp = 56.5°F
|
Normal Mean = 54.5°F
|
|
Total Precip.= 0.20 inches
|
Normal Precip = 1.65 inches
|
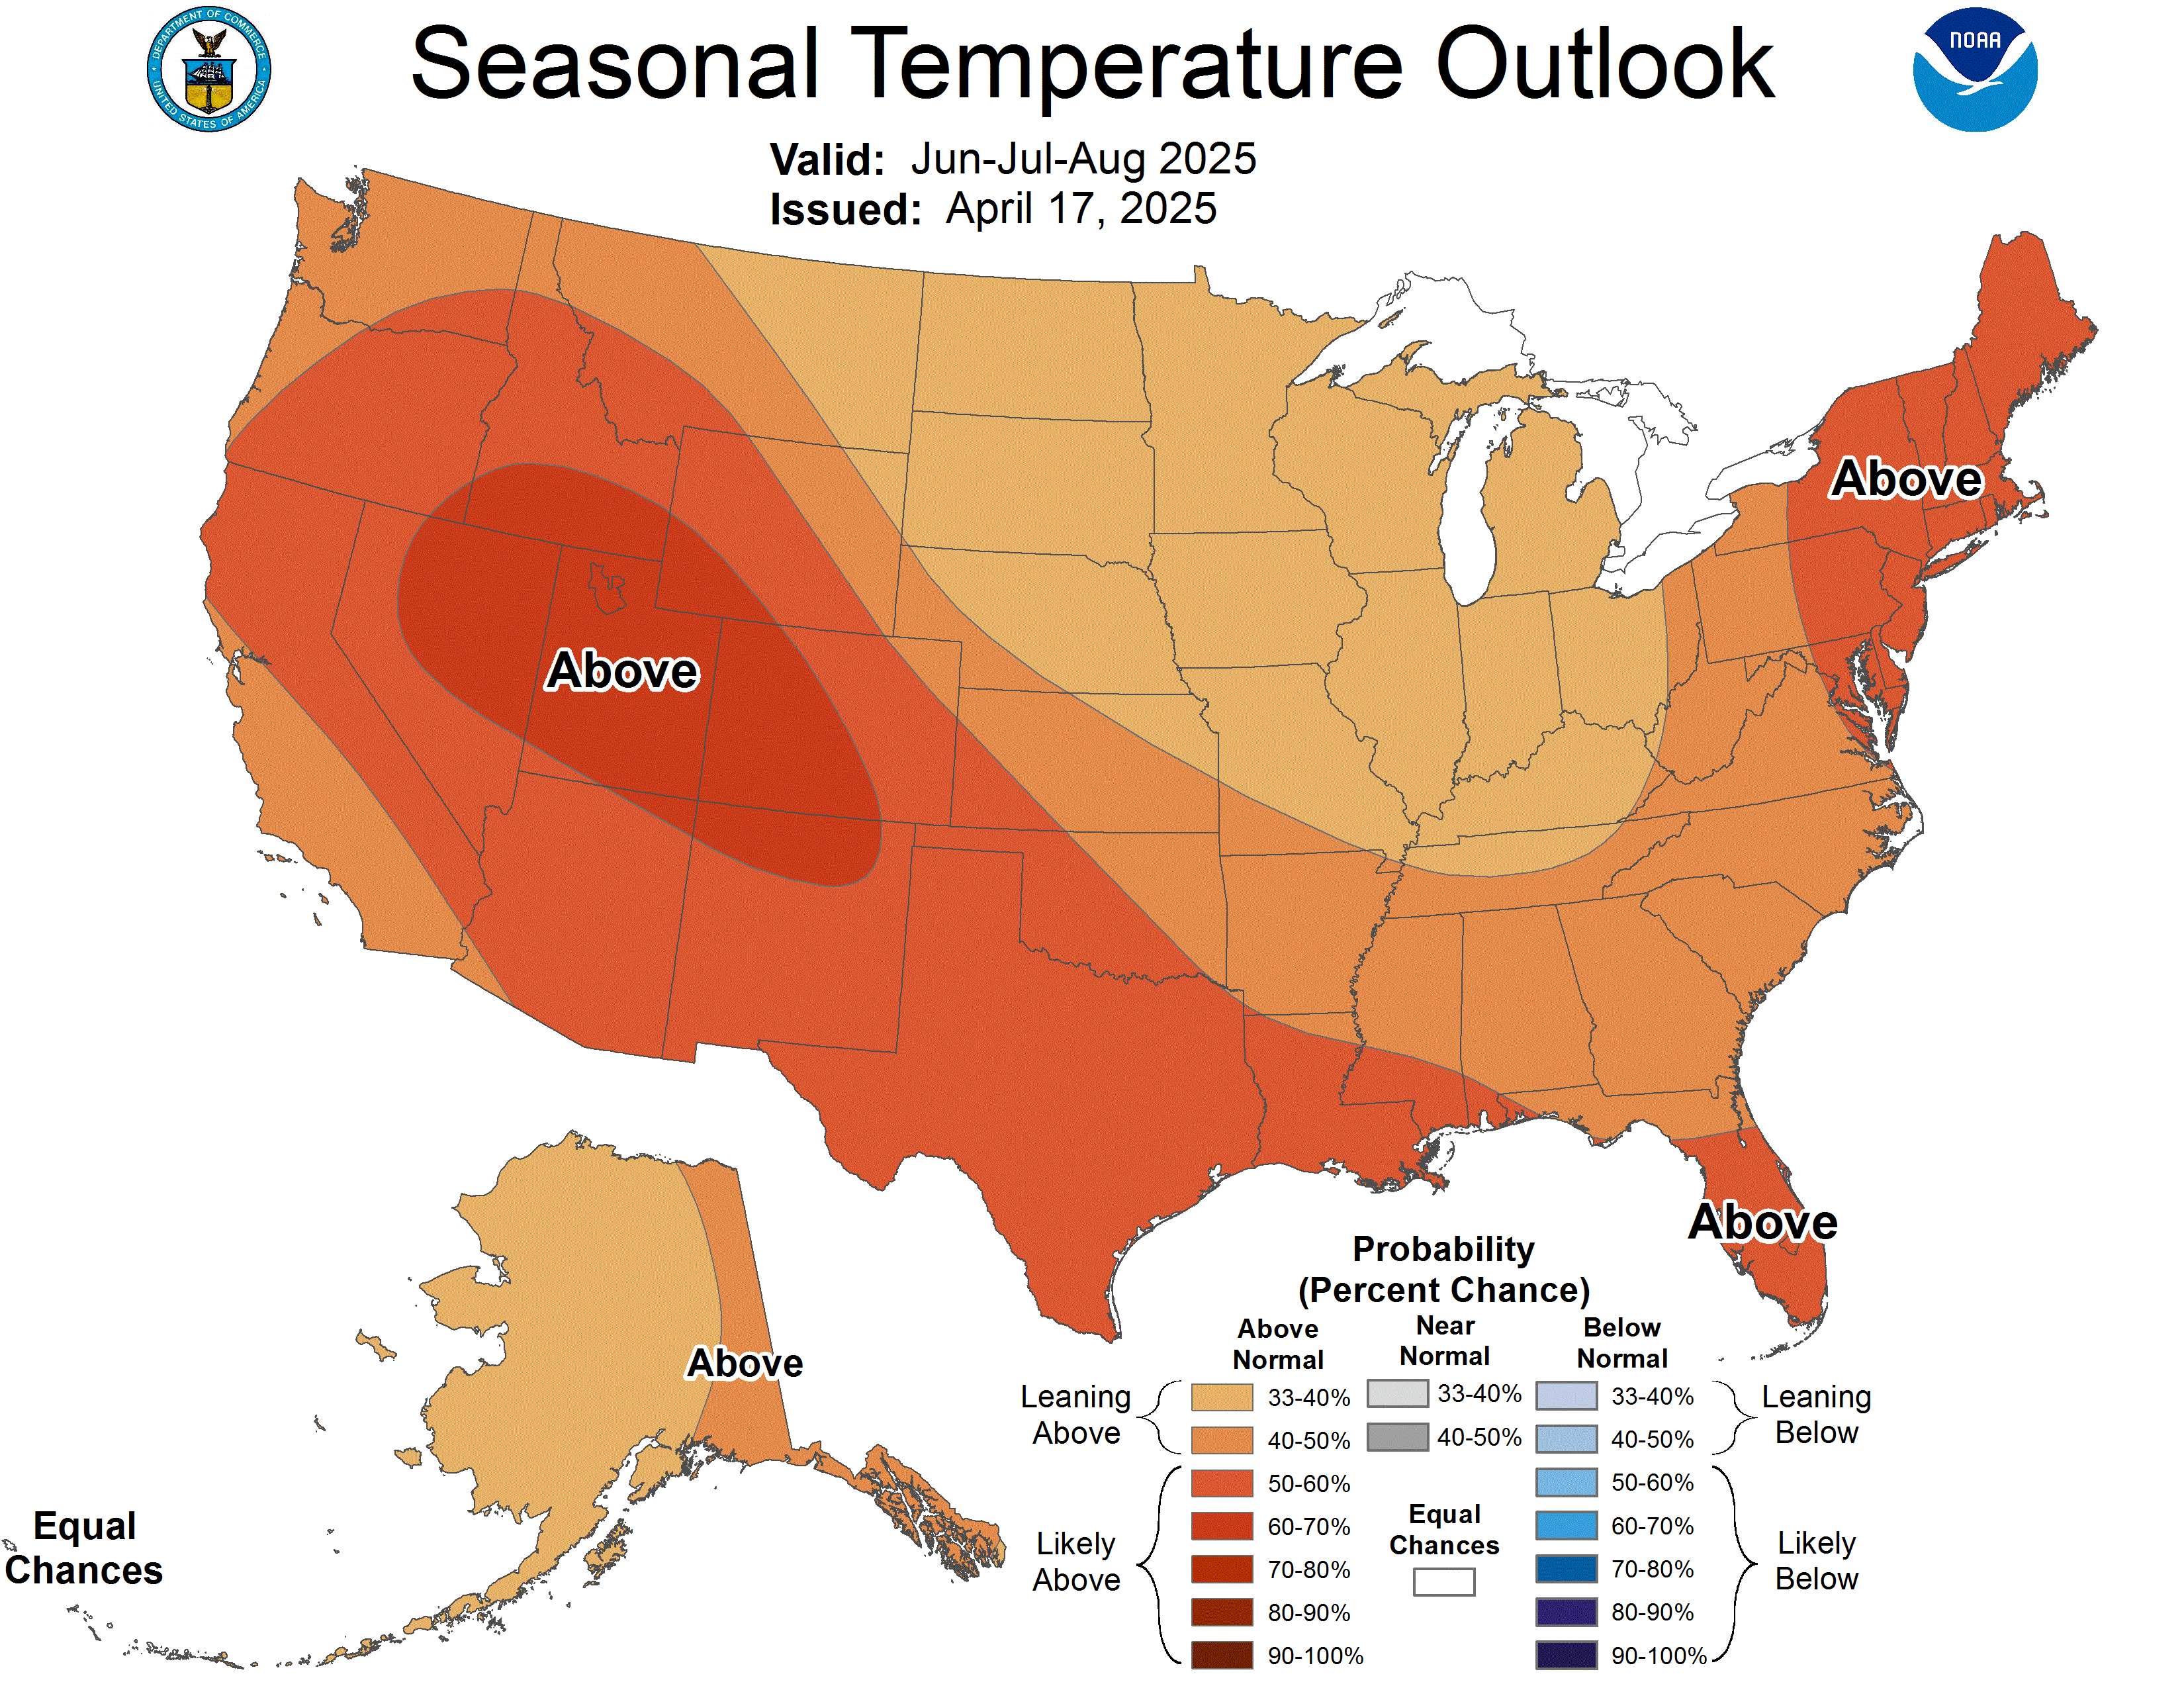
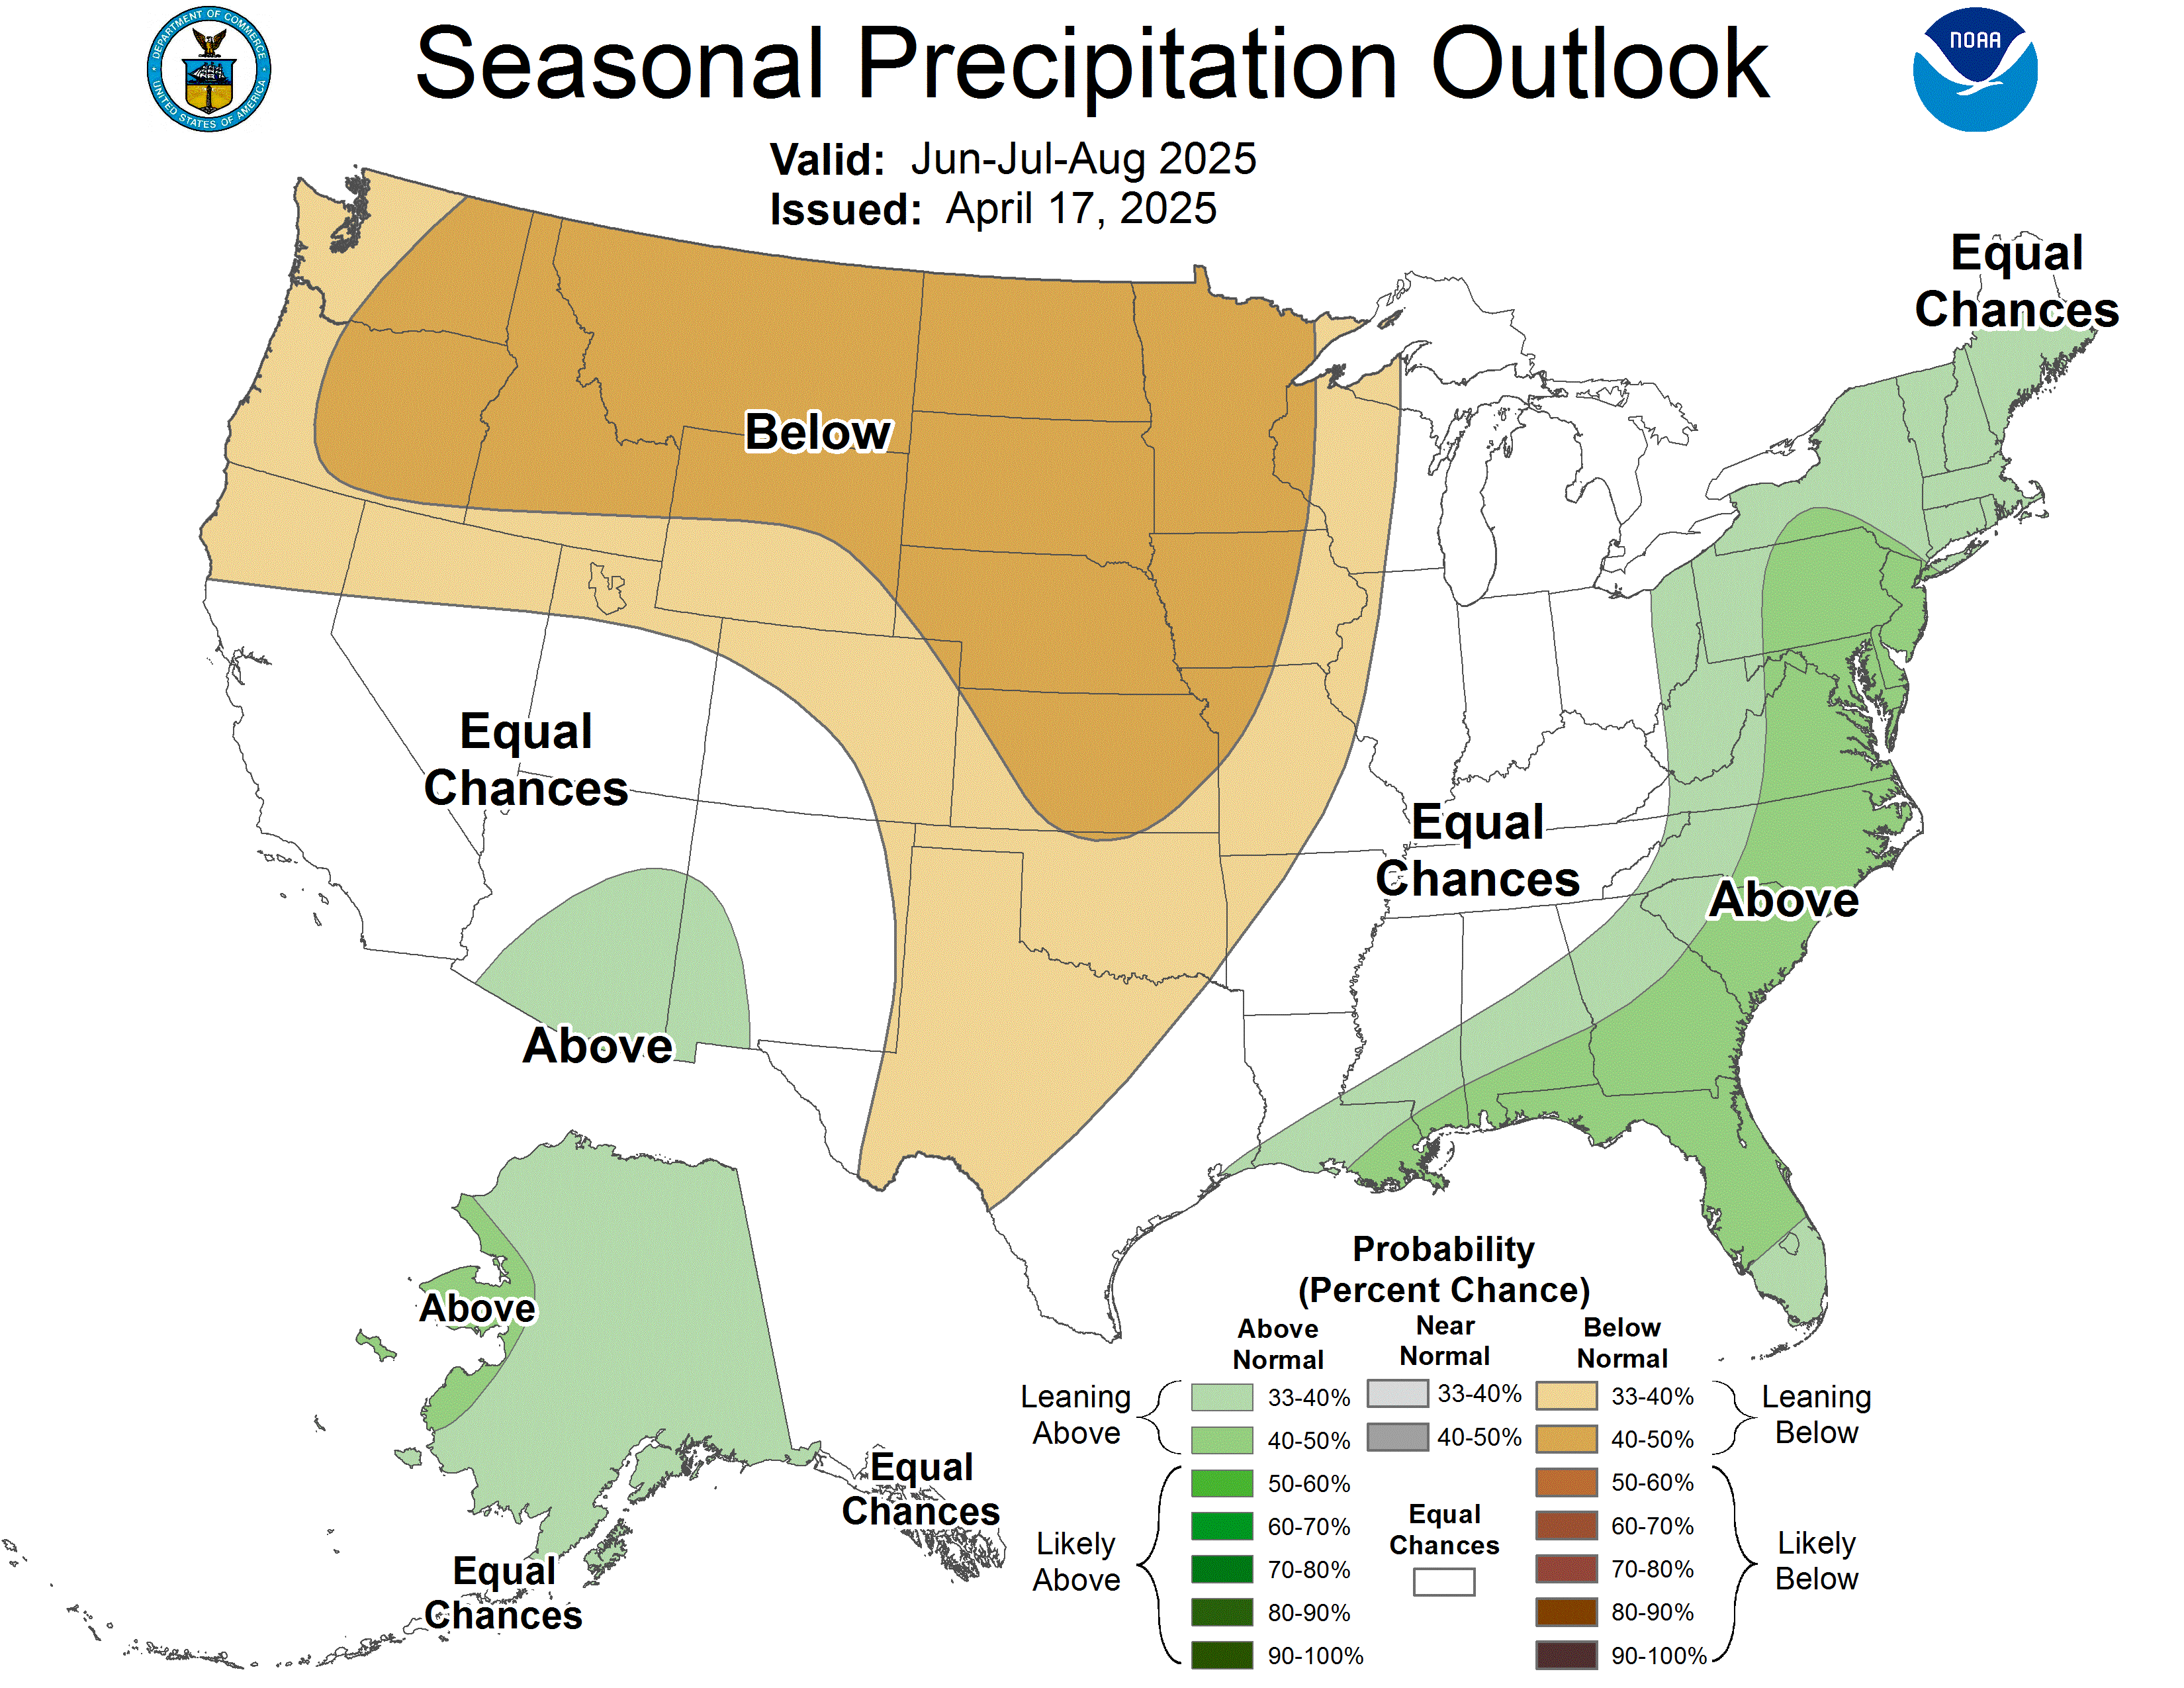
Look Ahead to July
The latest 30-day Outlook for July indicates above normal temperatures and equal chances of above or below normal precipitation (see maps below). The Pacific Northwest is expected to be below normal and areas to the south of us, like the southern and central Rockies, are expected to see above normal precip. That will likely be due to an active monsoon season, which is beginning this week. (See blog post from last summer about the Monsoon).
For more info about long range weather forecasts, click here and go to the bottom of the : MountainWeather.com Outlooks Page
 |
| July 2012 Temperature Outlook |
 |
| July 2012 Precipitation Outlook |
Text by meteorologist Jim Woodmencey
Graphics from NWS
Data for June 2012 is from the USFS “automated” weather station, and is compared to the old historical record which was all taken “manually for the last 70+ years.
Data for June 2012 is from the USFS “automated” weather station, and is compared to the old historical record which was all taken “manually for the last 70+ years.